5 Metrics Every Commercial Insurance Executive Should Track Weekly (But Probably Doesn't)
Most insurance executives see quarterly reports. By then, the problems they reveal are already 90 days old. Here are the five numbers that should be on your desk every Monday.
Insurance is a business of leading indicators. A submission that stalls in clearance today becomes a lost quote next week and a missed premium target next quarter. A producer whose hit ratio drops from 30% to 18% in February will show up as a premium shortfall in your June board report — but by then you've lost 4 months of potential intervention.
The problem isn't that executives don't want to see the data earlier. It's that the data isn't available earlier — at least not without asking someone to build a new report. Here are five metrics that should be visible to leadership every week, without asking anyone to pull them.
1. Stalled Submission Count
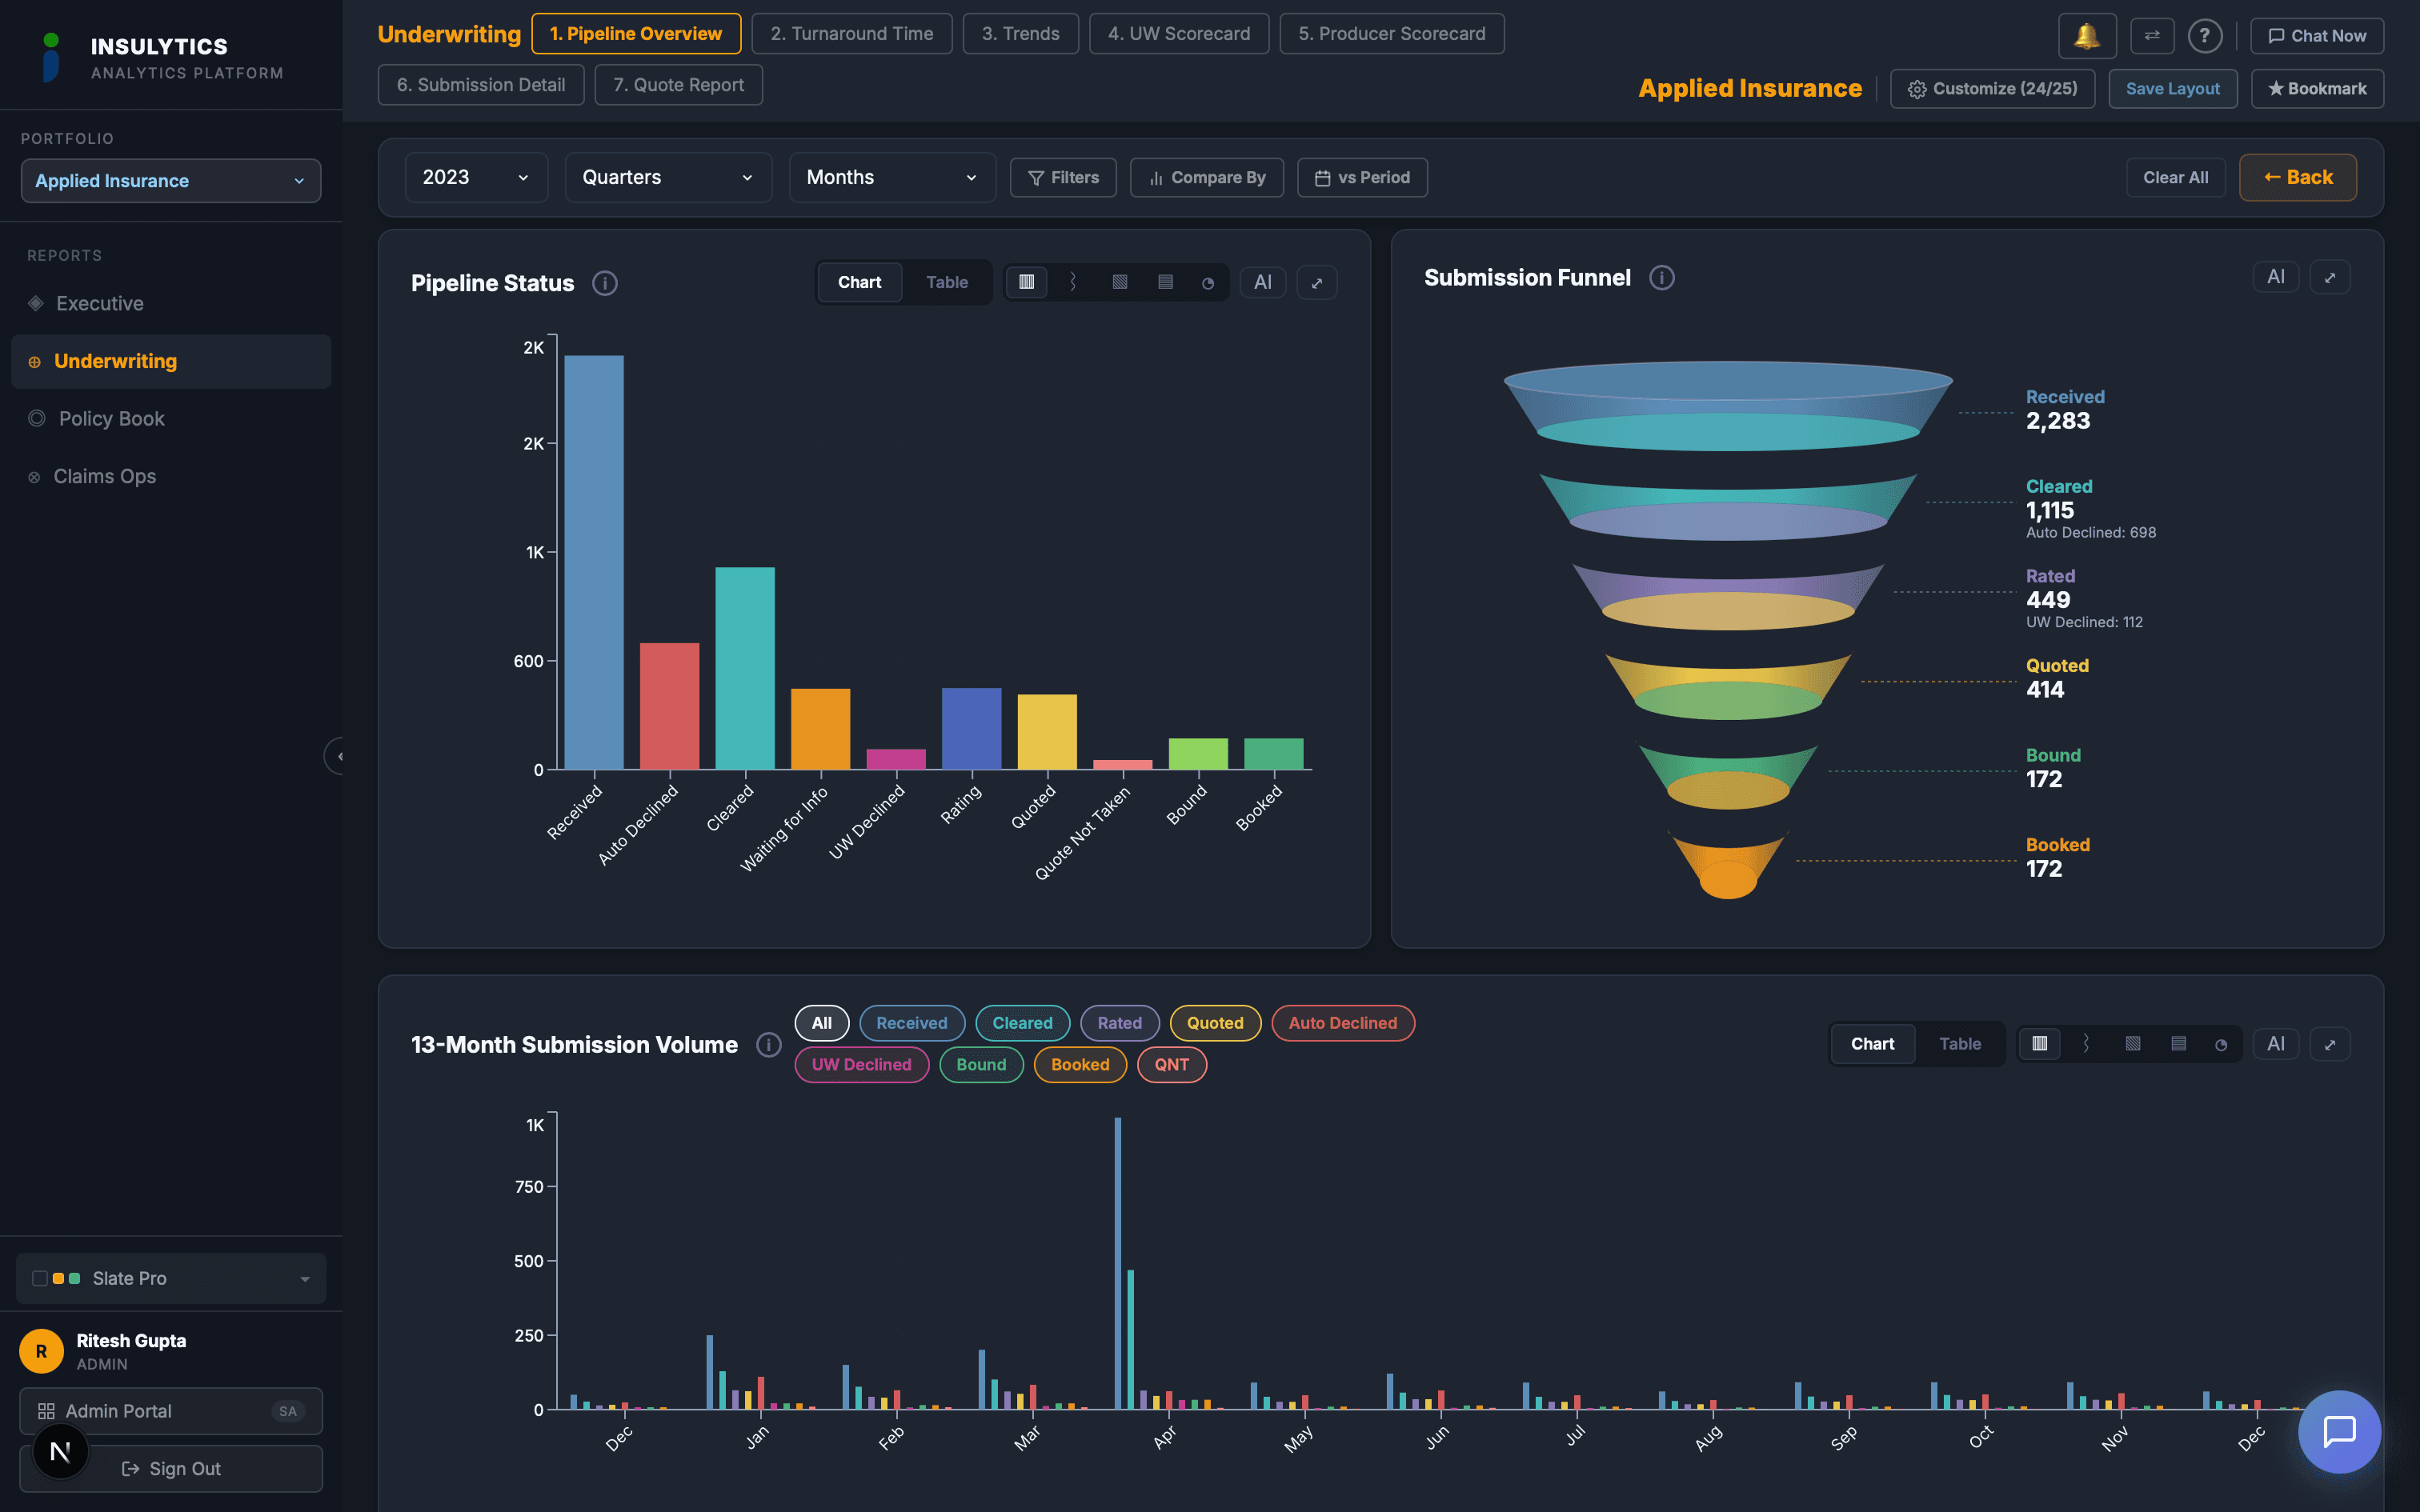
This is the number of submissions currently sitting in your pipeline with no activity for more than 5 business days. Not submissions that were declined or quoted — submissions that are stuck. Received but not cleared. Cleared but not rated. Quoted but not responded to.
Most organizations don't track this number because it requires comparing the current status of every open submission against a time threshold. In a spreadsheet, that's a project. In a pipeline dashboard, it's a filter.
Why it matters: stalled submissions are the leading indicator of lost premium. Every submission that expires before a quote is issued represents revenue that walked away without anyone making a decision about it. At one MGA we worked with, 30% of all submissions were expiring before quote — and nobody knew until they could see the pipeline in real time.
What to watch for:If your stalled count is growing week over week, you have a capacity problem, a process problem, or both. If it spikes on specific days (like Tuesdays after a bulk upload), you have a workflow scheduling problem. If it's concentrated in one underwriter's queue, you have a workload distribution problem.
2. Hit Ratio by Segment
Your overall hit ratio is useful for board reporting. It's useless for management. The number you need every week is hit ratio broken down by LOB, producer, and underwriter — and compared to the same week or month in the prior year.
The overall number hides everything. A 22% hit ratio sounds acceptable until you realize your GL line is at 35% and your Property line is at 11%. The GL team is converting efficiently. The Property team has a problem — maybe pricing, maybe clearance speed, maybe the producers feeding them are sending unqualified risks. You can't diagnose it from the aggregate.
The year-over-year comparison is equally important. If your Workers Comp hit ratio was 28% last Q2 and it's 19% this Q2, something changed. New competitors? Rate increases that overshot the market? A producer who shifted their best business elsewhere? You can't answer those questions without the comparison, and you can't wait until the quarterly report to start asking them.
What to watch for: Any segment where hit ratio drops more than 5 points from the prior year warrants investigation that week, not next quarter. Also watch for segments where hit ratio is high but volume is low — those might be your most profitable lines that deserve more marketing investment.
3. Average Clearance-to-Quote Cycle Time
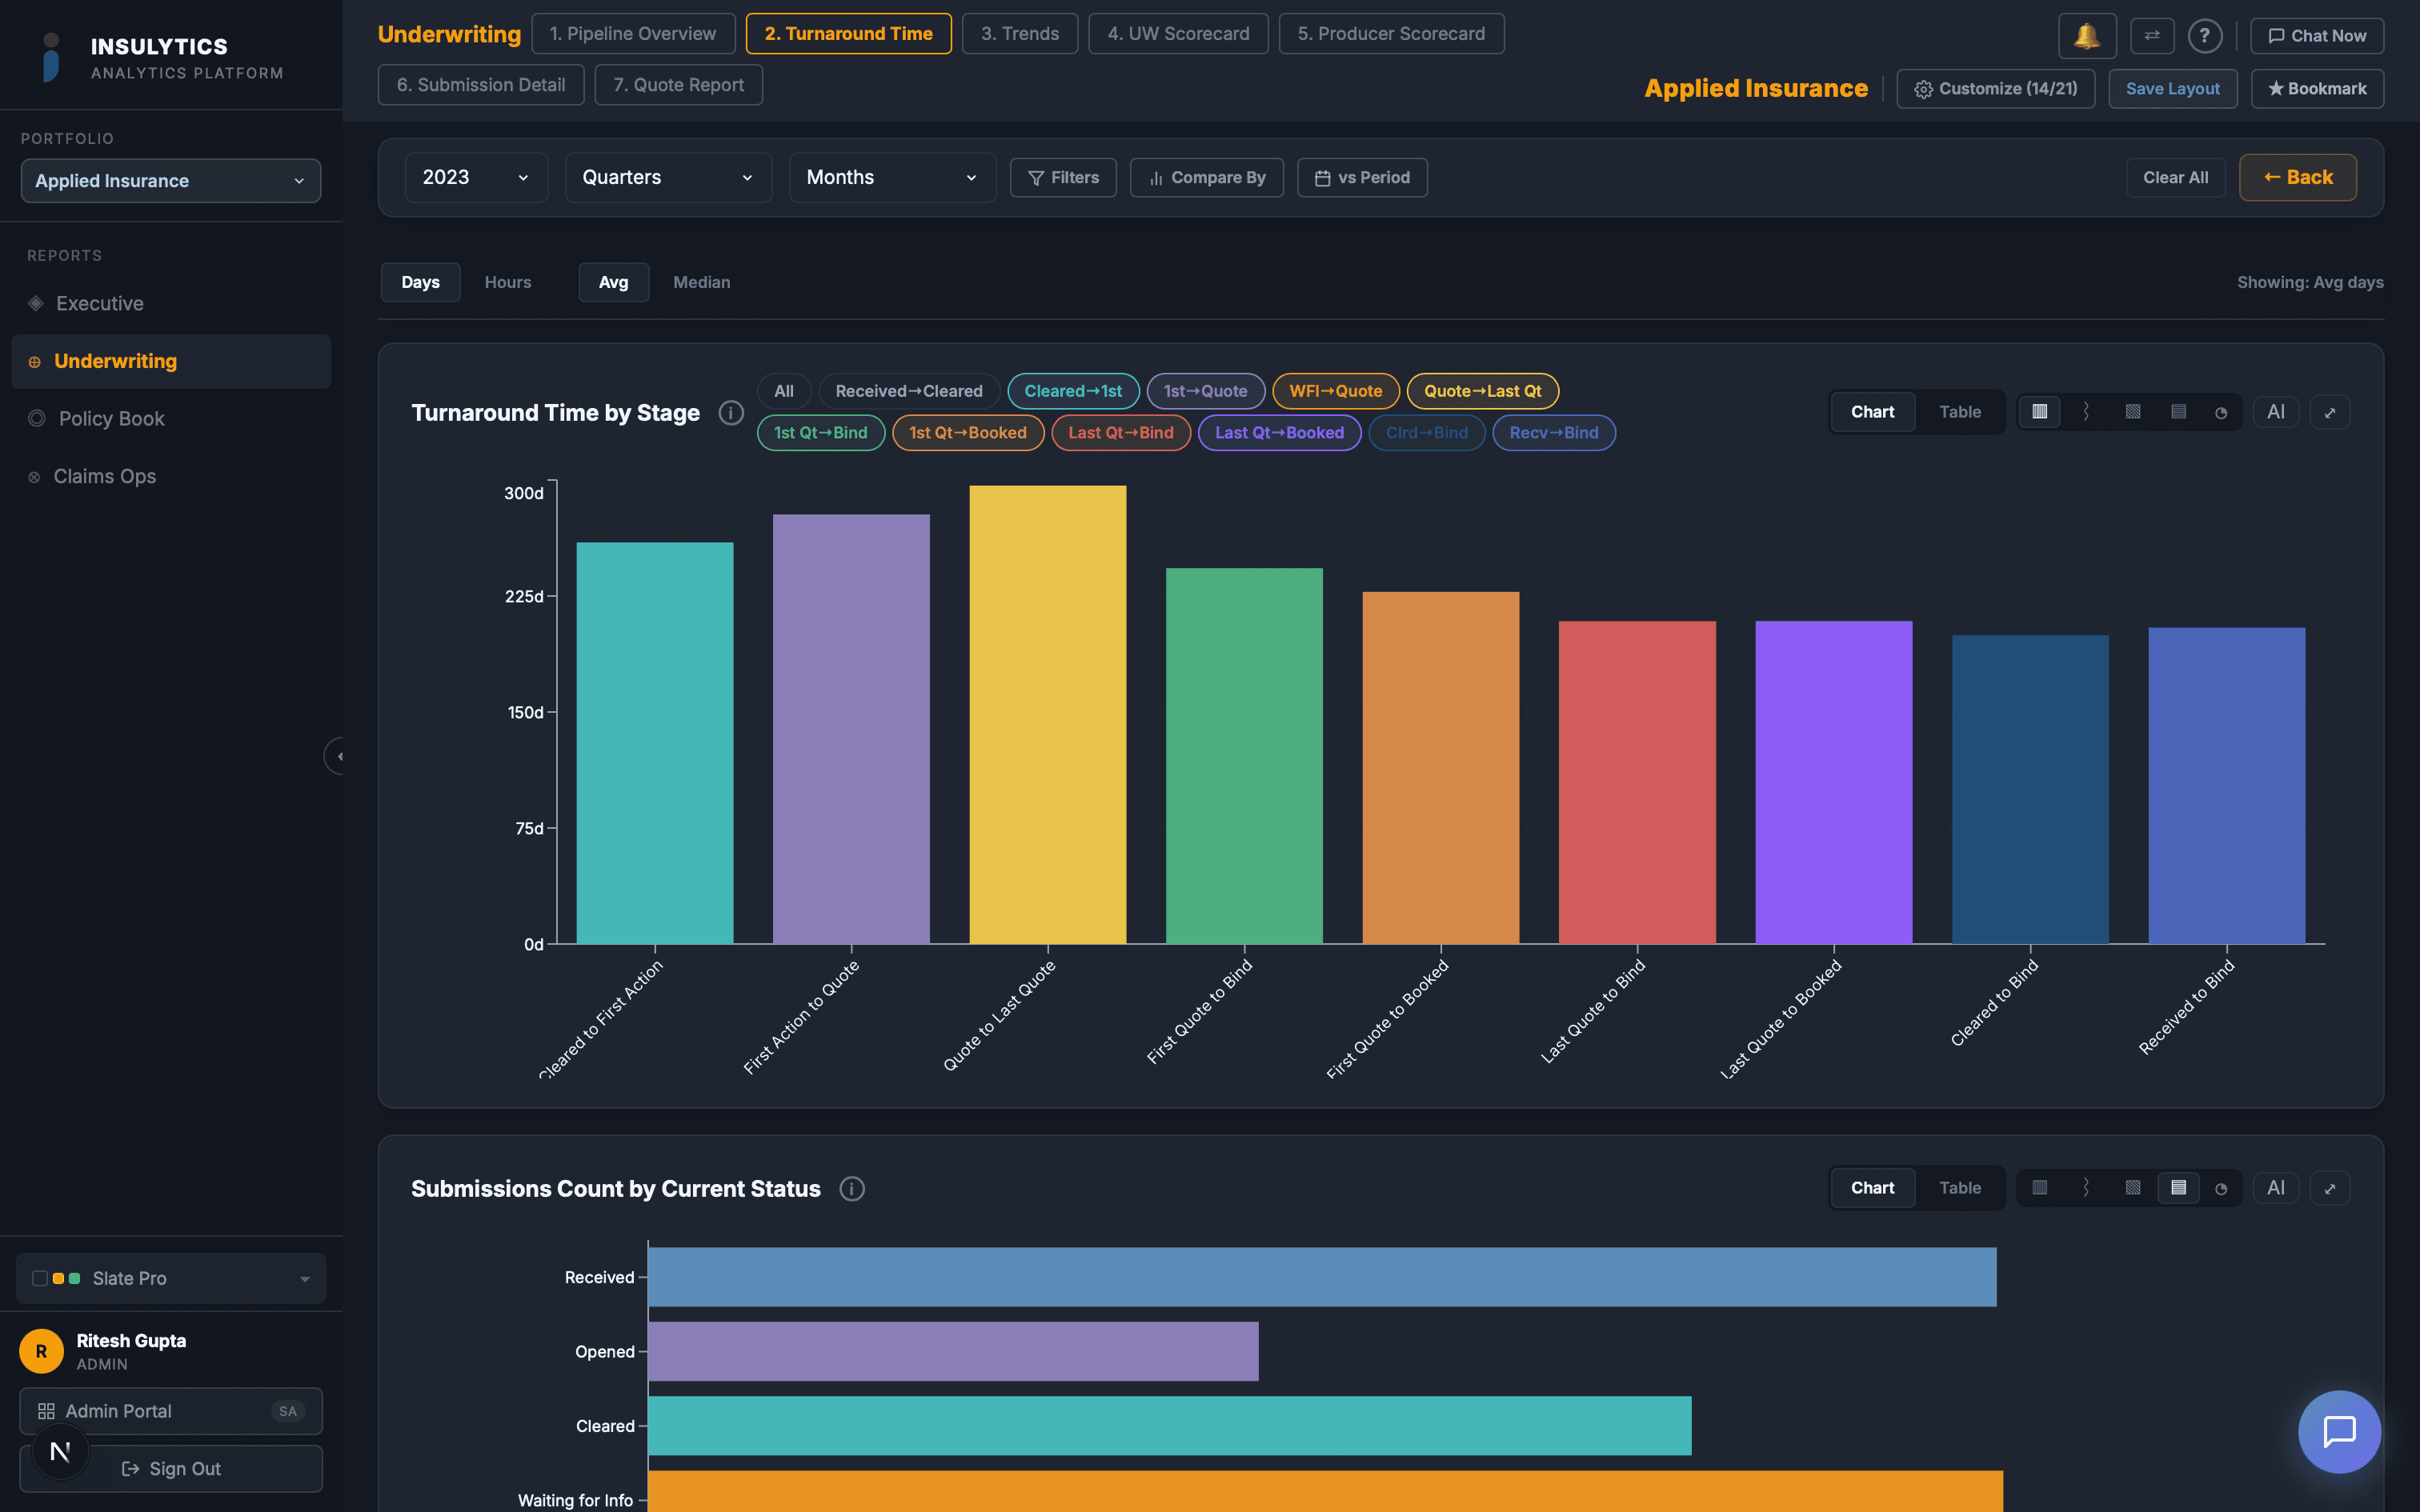
This is the average number of business days from when a submission clears underwriting review to when a quote is issued. It's the metric that most directly measures your speed to market — and your competitive position on every deal where a broker is shopping multiple carriers.
Brokers don't tell you when they've moved on. They just stop following up. If your clearance-to-quote time is 8 days and your competitor's is 3, you're not losing deals because of pricing — you're losing them because the broker already placed the account before your quote arrived.
The weekly trend is what matters. If your average is creeping from 4.2 days to 5.1 days to 6.3 days over three weeks, something is happening. New product complexity? An underwriter out on leave? A class code that requires manual lookup? The earlier you see the trend, the faster you can intervene.
What to watch for:Break this metric down by underwriter and LOB. You'll almost always find that the average is skewed by one or two underwriters or one slow-moving line. Fix the outlier and the average drops immediately.
4. Retention Rate by LOB (Rolling Quarter)
Most carriers track retention annually — if they track it at all. The problem with annual retention is that by the time you see a decline, it's been happening for months. A rolling quarterly view gives you the leading indicator.
Retention is deceptively simple to misunderstand. A carrier might report 85% overall retention, which sounds healthy. But if their largest LOB (say, Workers Comp at 40% of premium) has 92% retention and their smallest LOB (Professional Liability at 8% of premium) has 55% retention, the overall number masks a serious problem in a growing line.
The rolling quarter view catches trends earlier because it's less noisy than monthly but more responsive than annual. If your GL retention was 82% in the trailing quarter and it's now 76%, you have approximately one quarter to figure out why before it becomes an annual problem.
What to watch for:Retention declines that correlate with rate increases. If you raised GL rates by 8% and retention dropped by 6 points, you need to assess whether the lost accounts were profitable or unprofitable. Losing unprofitable accounts after a rate increase is healthy. Losing your best accounts because competitors didn't follow your rate is not.
5. Loss Ratio Trend by Accident Year
Calendar year loss ratio is the number most people track. It's also the number most likely to mislead you. Calendar year includes reserve adjustments, late-reported claims, and development on prior years — all of which obscure what's actually happening with the business you're writing today.
Accident year loss ratio, viewed as a monthly or quarterly trend, tells you whether your current underwriting is producing acceptable results. It strips out the noise from prior years and focuses on the losses attributable to the policies you're actually writing and renewing.
The week-over-week change in AY loss ratio is the single most important trend line for an underwriting executive. If AY loss ratio for the current year is trending upward month over month, your pricing is inadequate, your risk selection is deteriorating, or you're experiencing a frequency or severity shift that needs investigation.
What to watch for:AY loss ratio that's improving overall but deteriorating in one LOB. That one LOB is being subsidized by the others, and the subsidy won't last forever. Also watch for AY loss ratio that looks good in aggregate but shows wide variance by underwriter — that suggests inconsistent risk selection practices.
Making These Visible Without Making More Work
The reason most executives don't see these numbers weekly isn't that they don't want them. It's that producing them requires someone to build a report — and that someone has a day job. The analytics team (if there is one) is already underwater with quarterly reporting, ad-hoc requests, and regulatory filings.
The solution isn't more analysts. It's a platform that computes these metrics continuously from the same data your systems already produce. The data exists — it's sitting in your policy admin system, your claims system, and your submission tracking tool. It just isn't connected, aggregated, or presented in a way that makes these five questions answerable without a project.
When we deploy Insulytics for a new client, these five metrics are live within the first two weeks — before the full dashboard library is even built. Because they're the first questions every insurance executive asks once they realize they can.