Analytics That Power Smarter Underwriting
Comprehensive scorecards for underwriters, claims handlers, and executives. Portfolio performance analytics, trend analysis, loss ratio optimization, and competitive market insights with full drill-down capabilities.
Challenges We Solve
Loss Ratio Blind Spots
Without granular analytics, identifying the drivers of loss ratio deterioration requires weeks of manual analysis and spreadsheet work.
Slow Underwriting Decisions
Lack of timely data on submission pipeline, quote activity, and bind rates slows down the underwriting cycle.
Limited Portfolio Visibility
Fragmented systems make it impossible to see the complete picture across lines of business, regions, and producers.
Dashboards Built for You
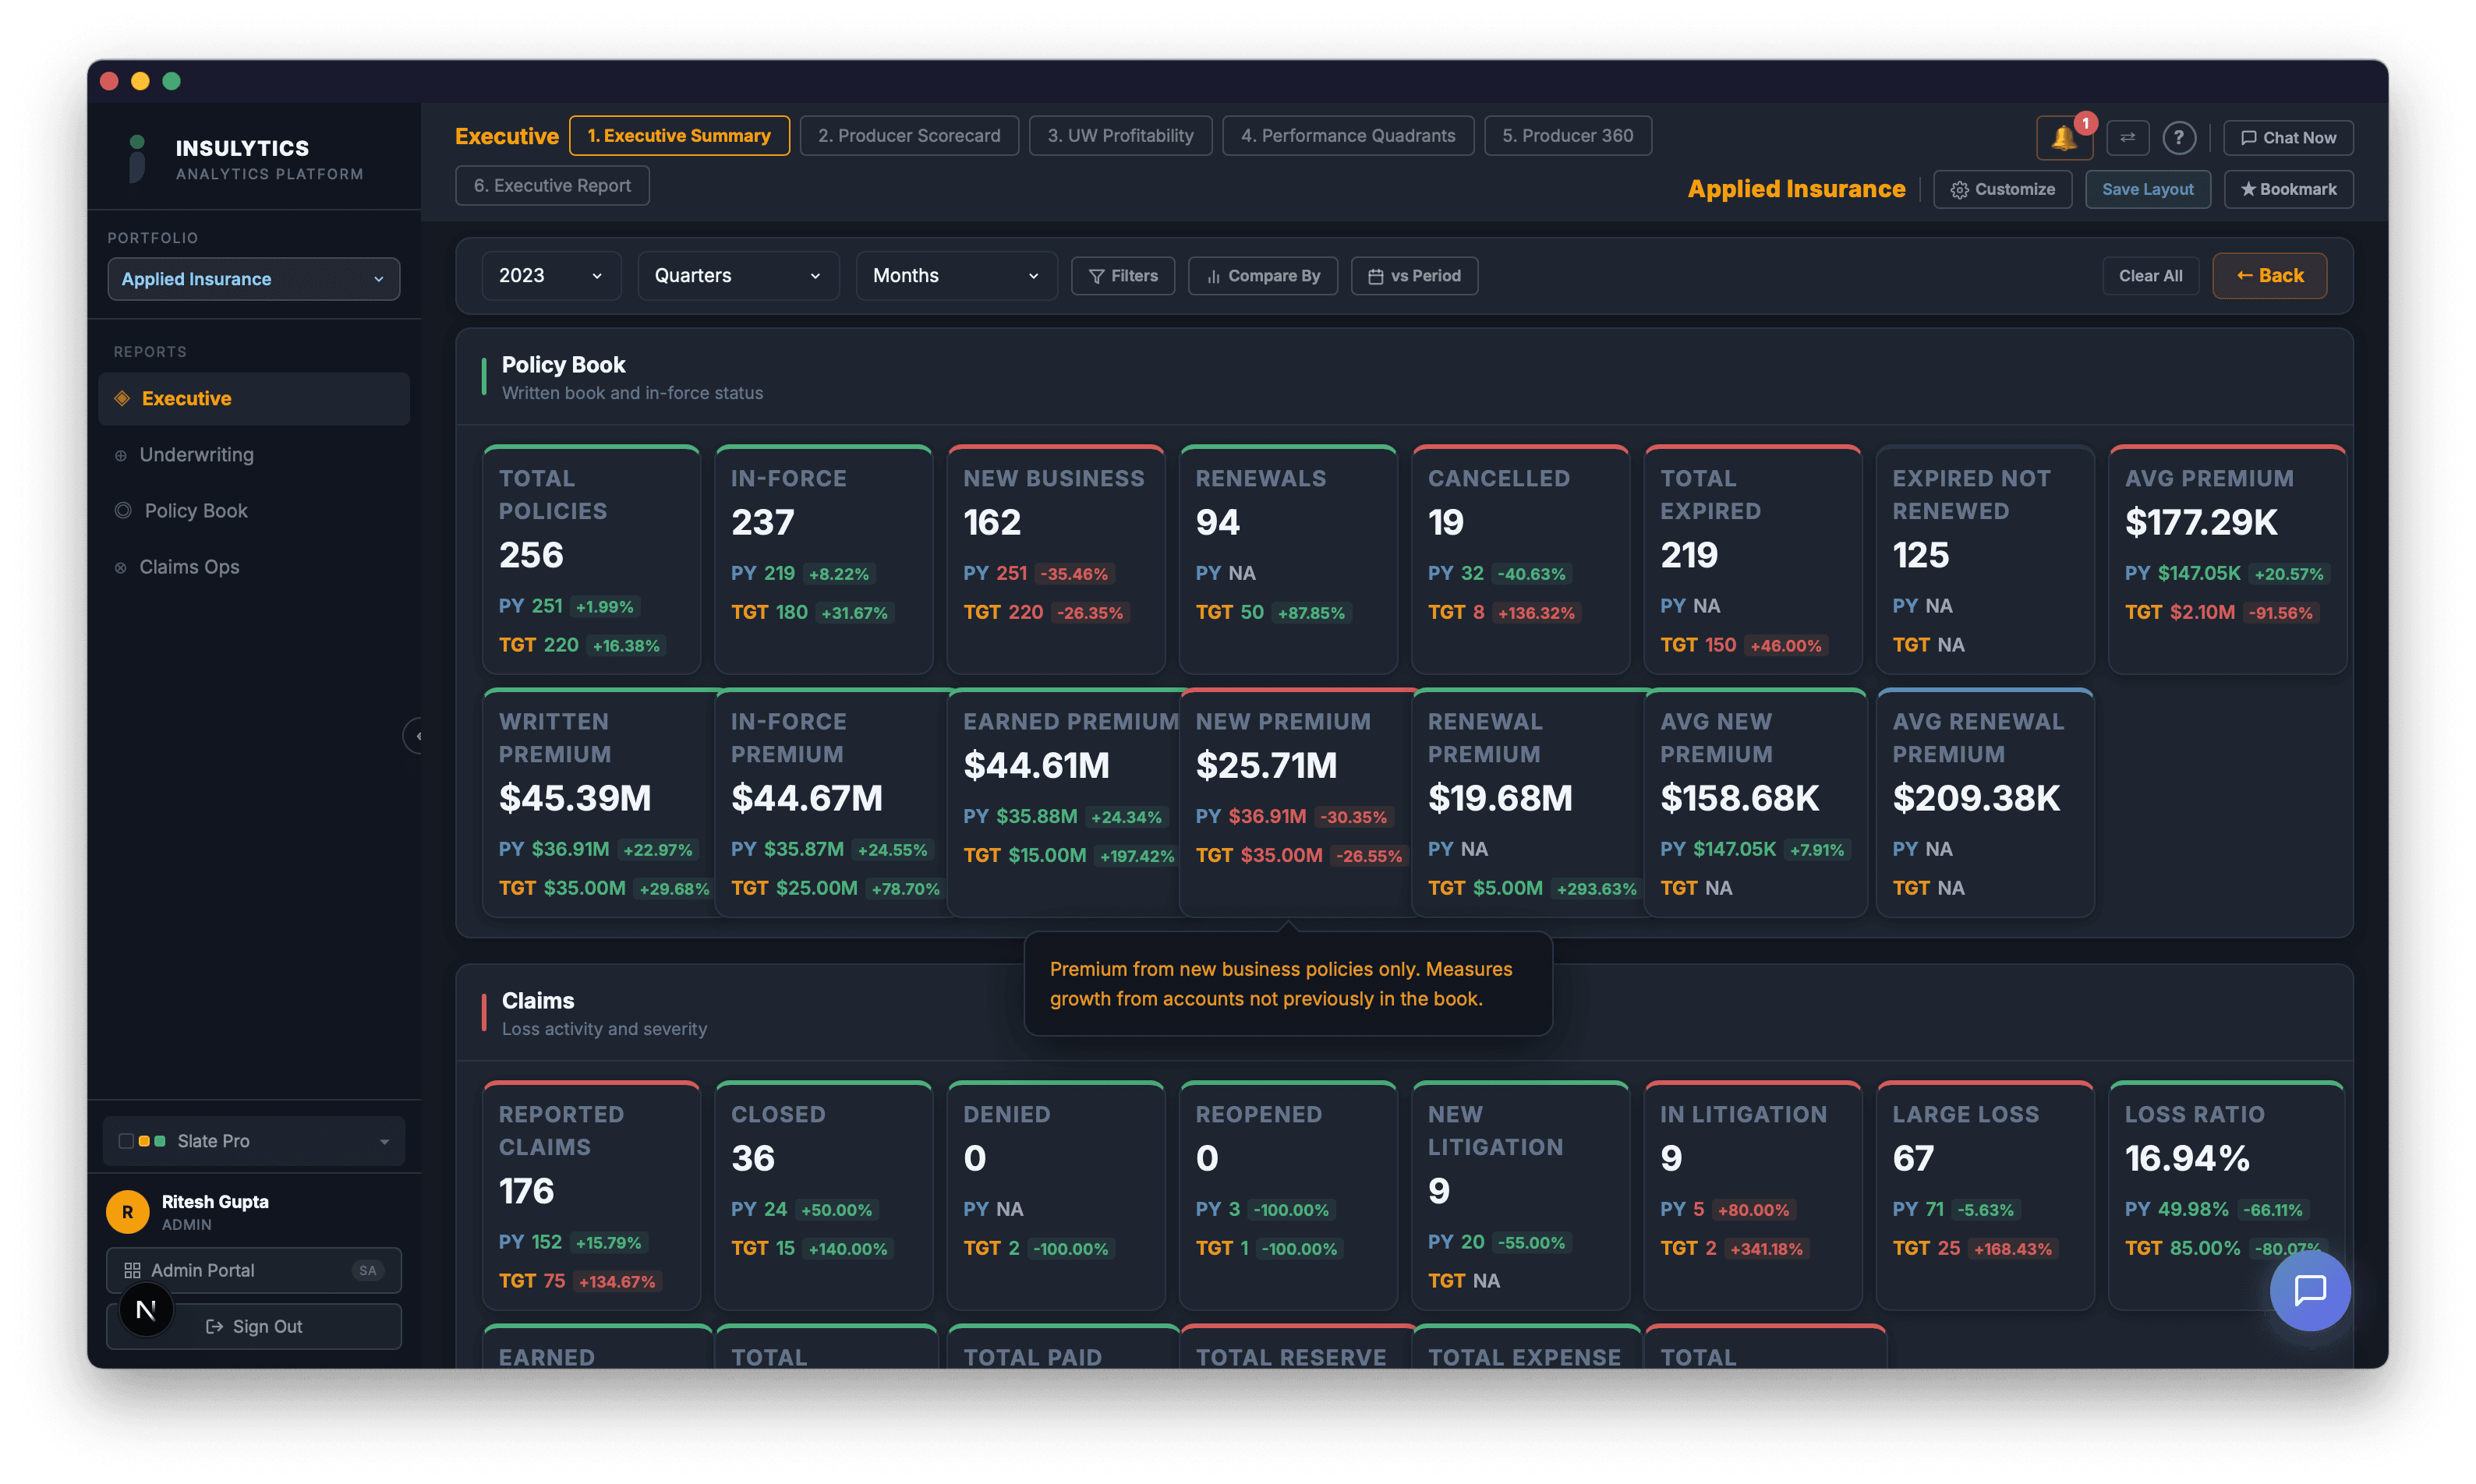
Executive Summary
Company-wide KPIs with trend lines, comparison to prior year, and Bloomberg-style data presentation.
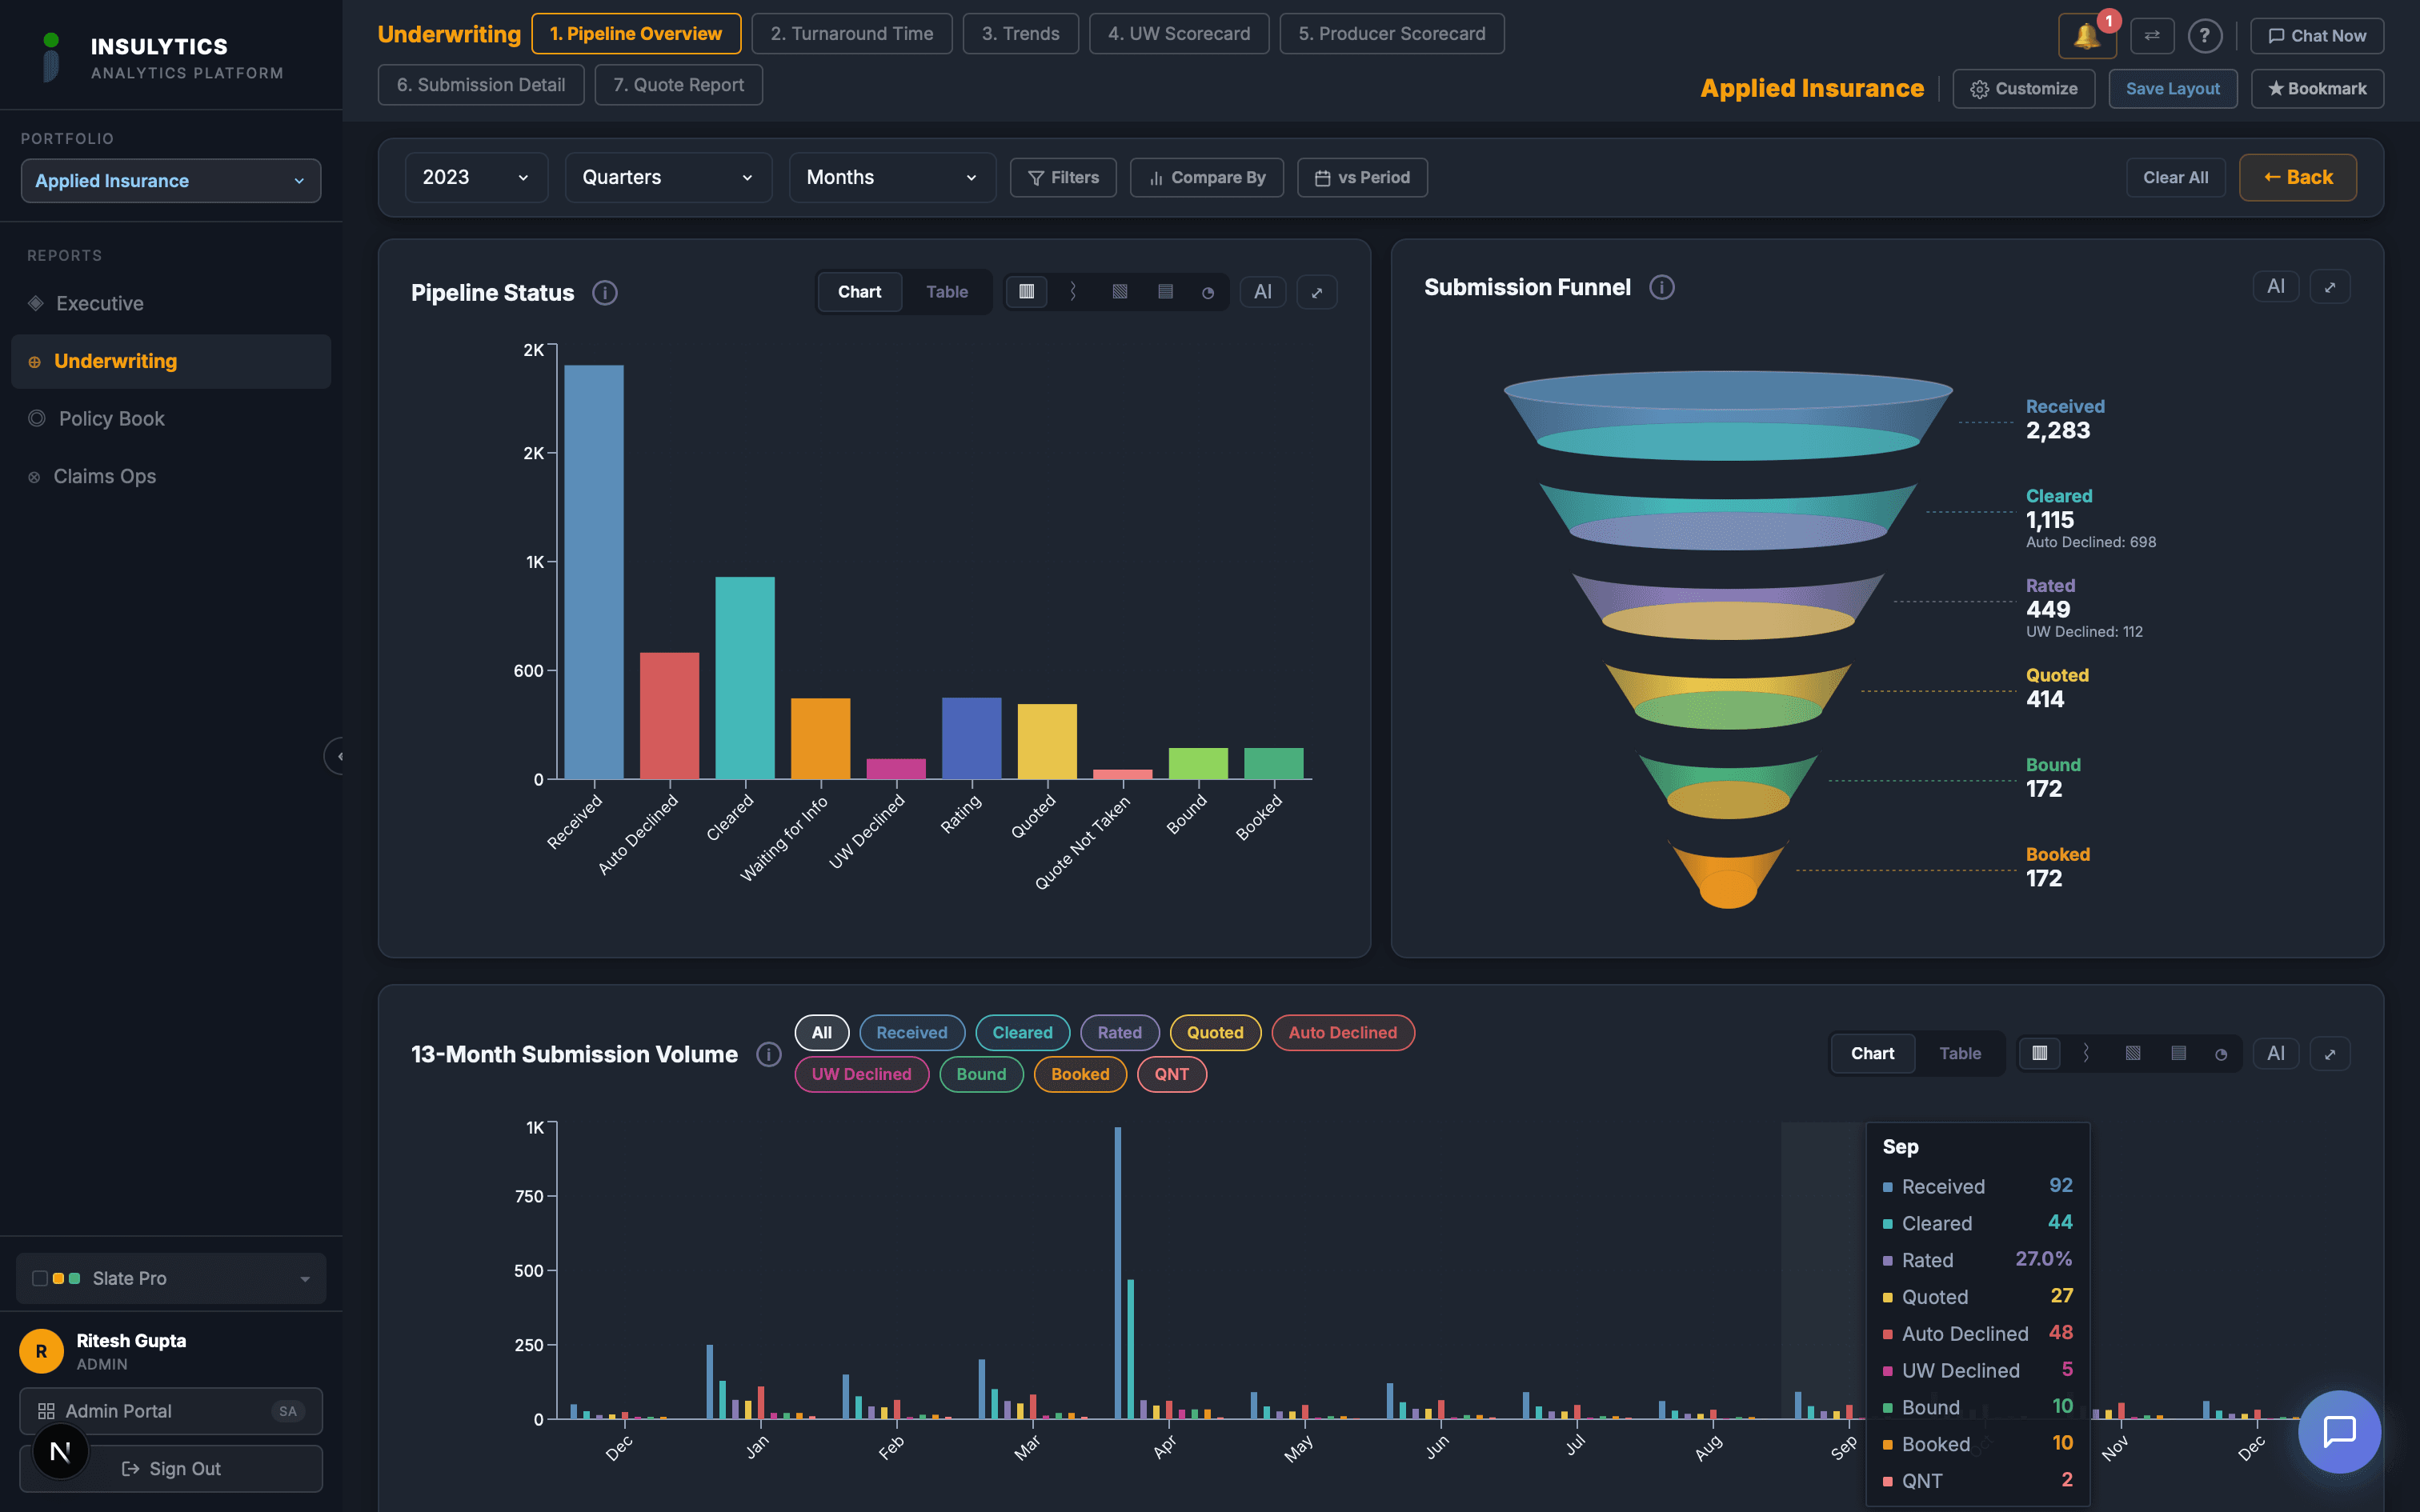
Submission Pipeline
End-to-end submission funnel from received to bound with conversion metrics at every stage.
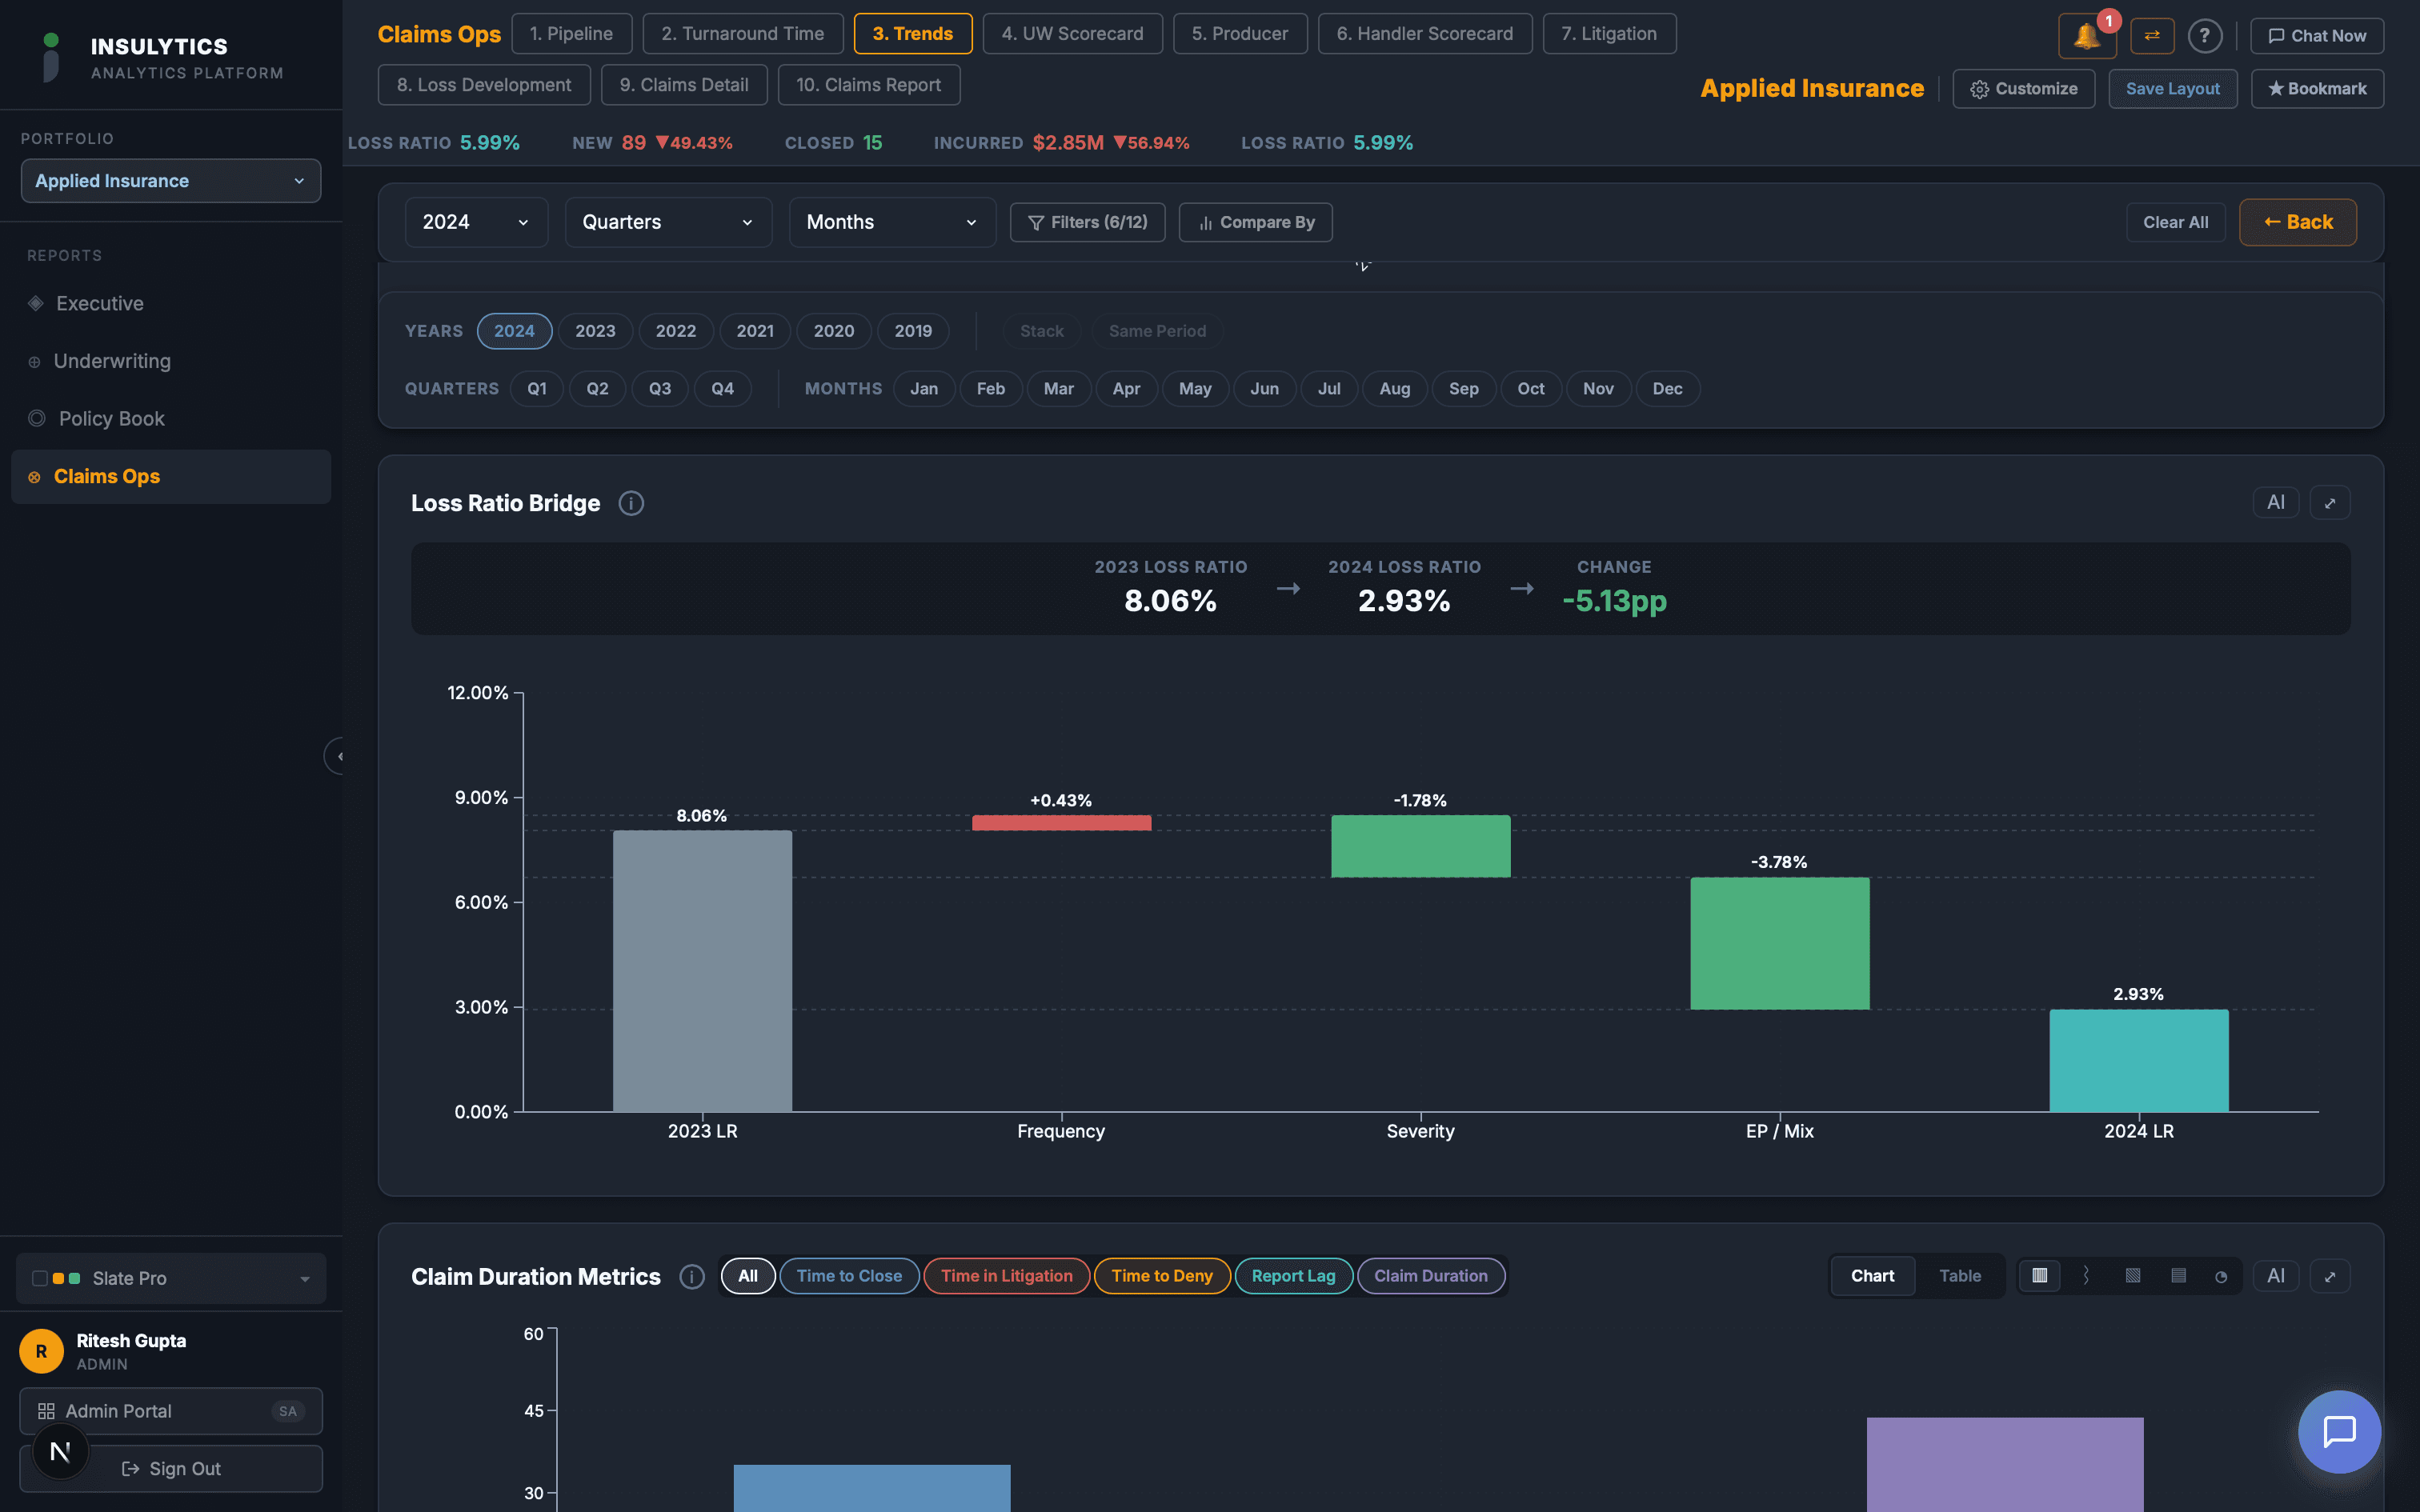
Claims Trends
Loss ratio, severity, frequency trends across accident year and calendar year with full drill-down.
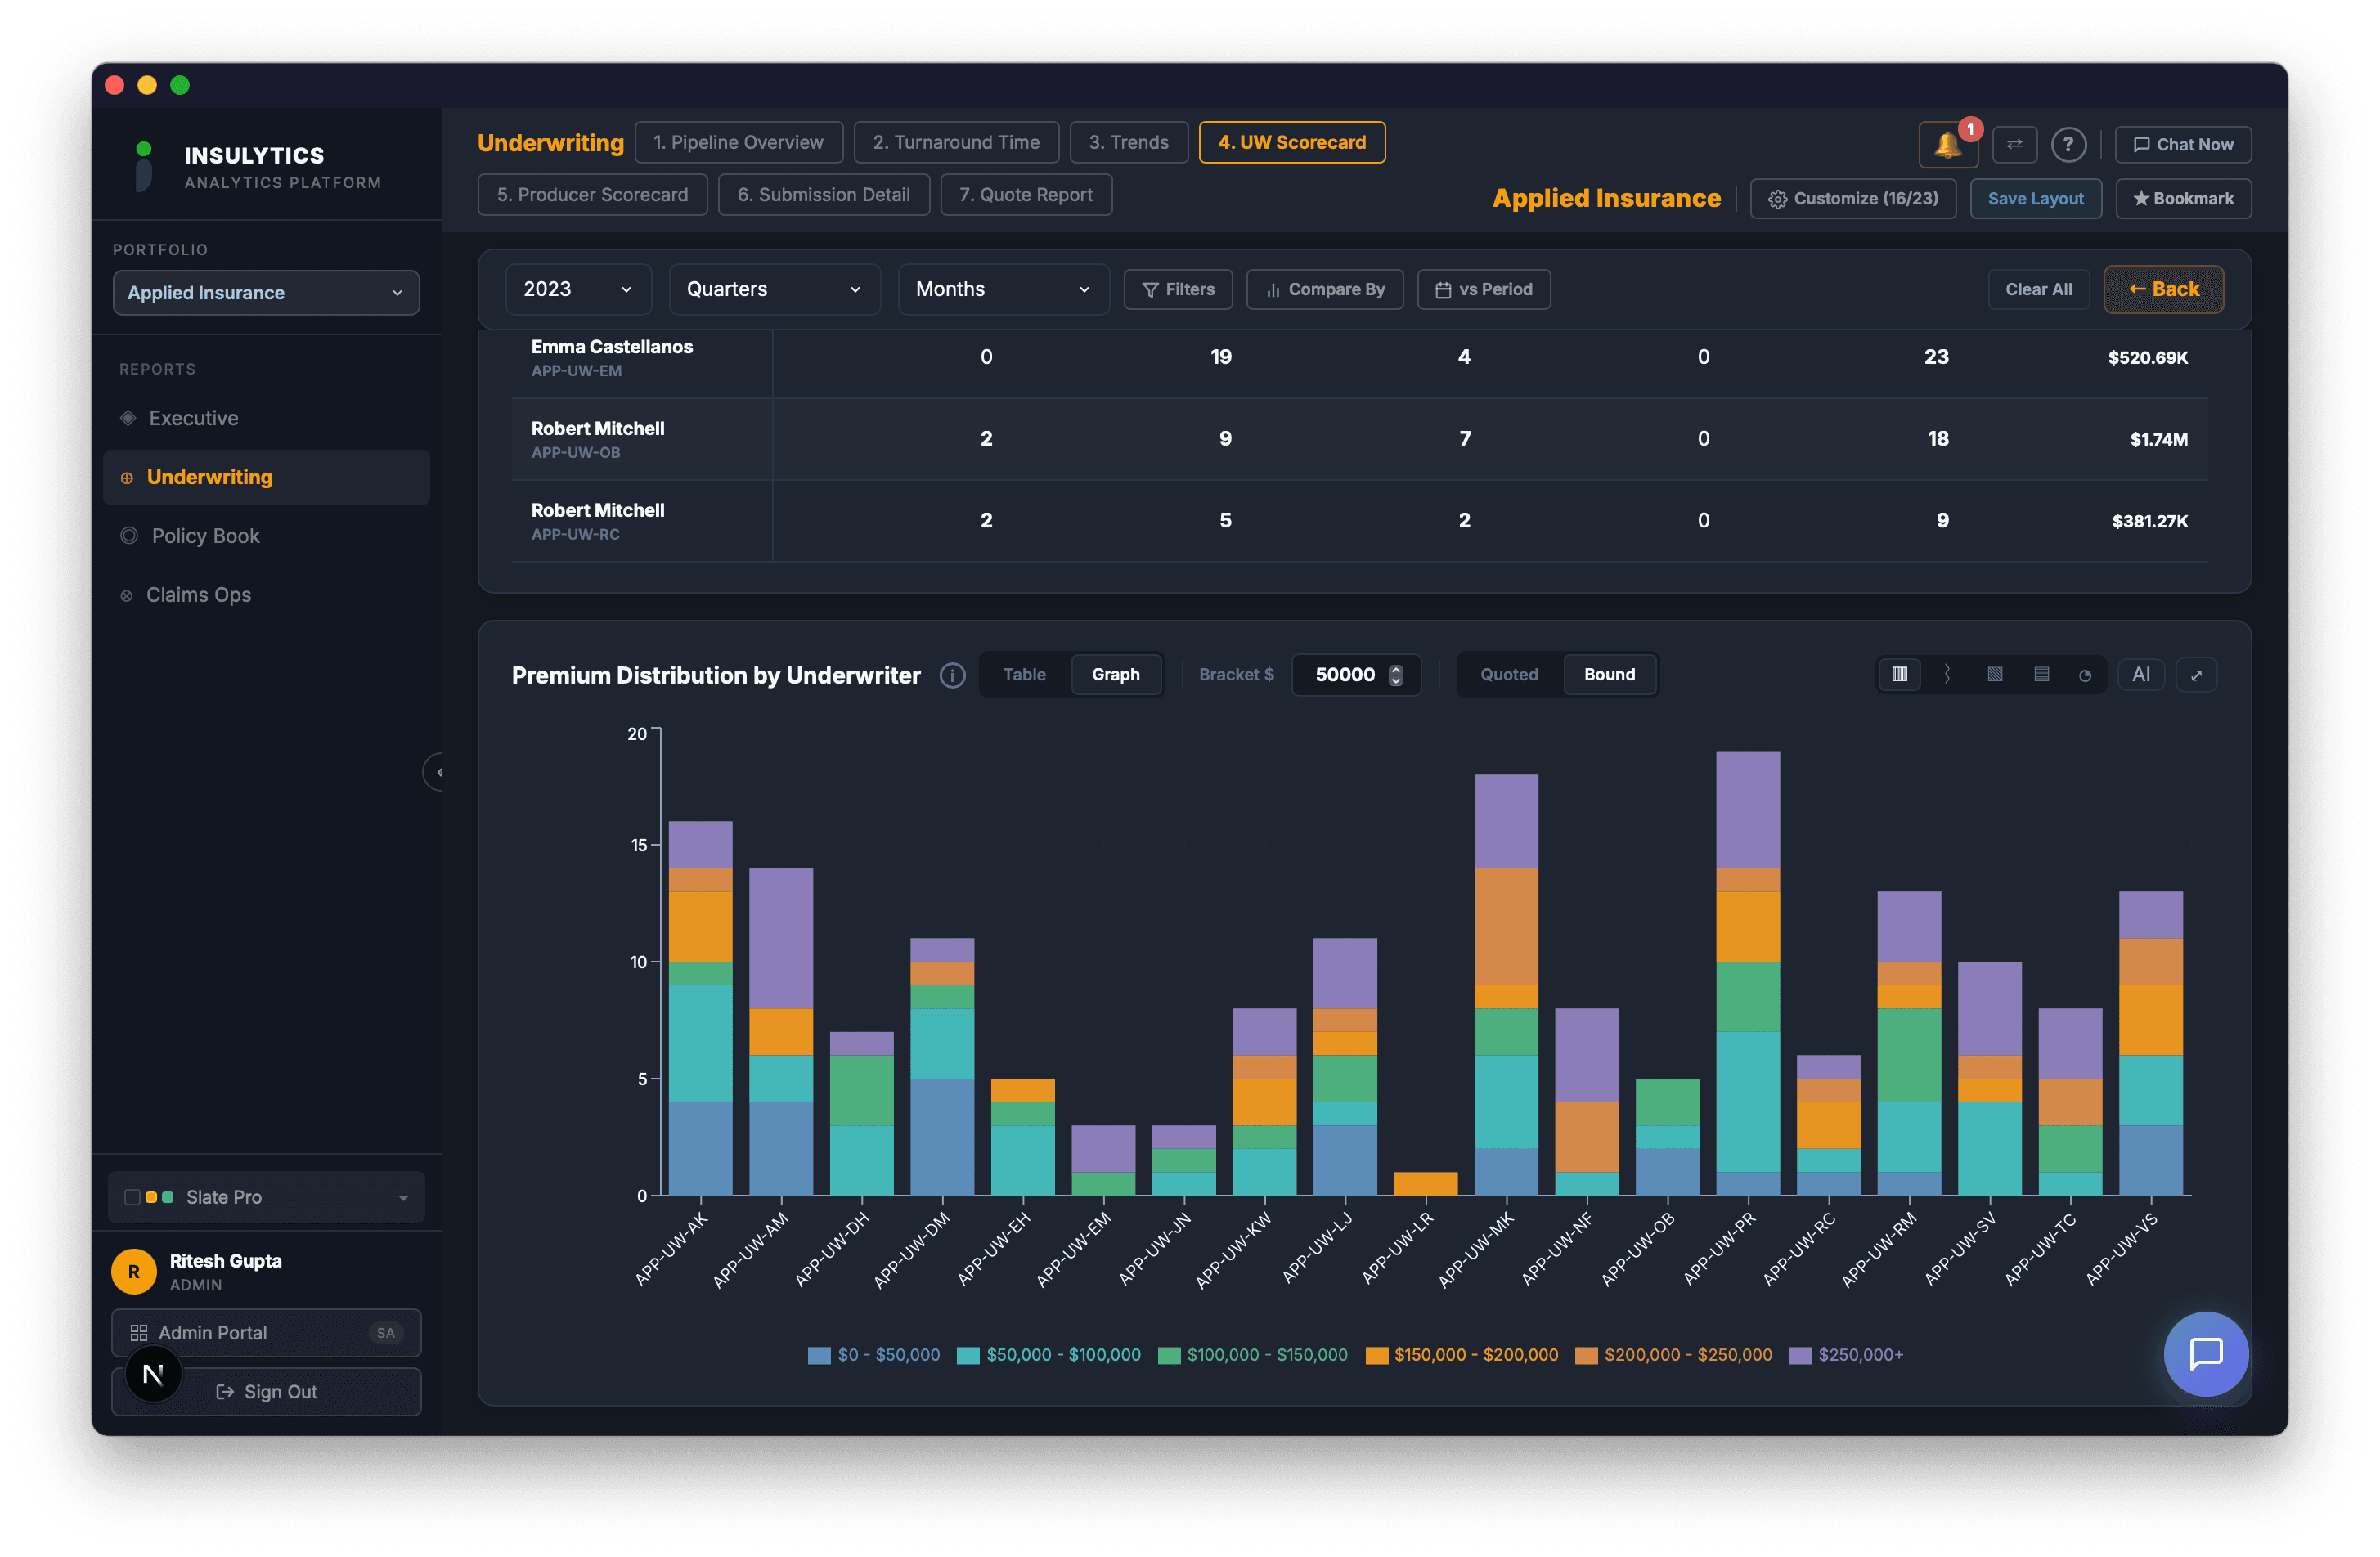
UW Scorecard
Individual underwriter performance across submissions, quotes, binds, and loss metrics.
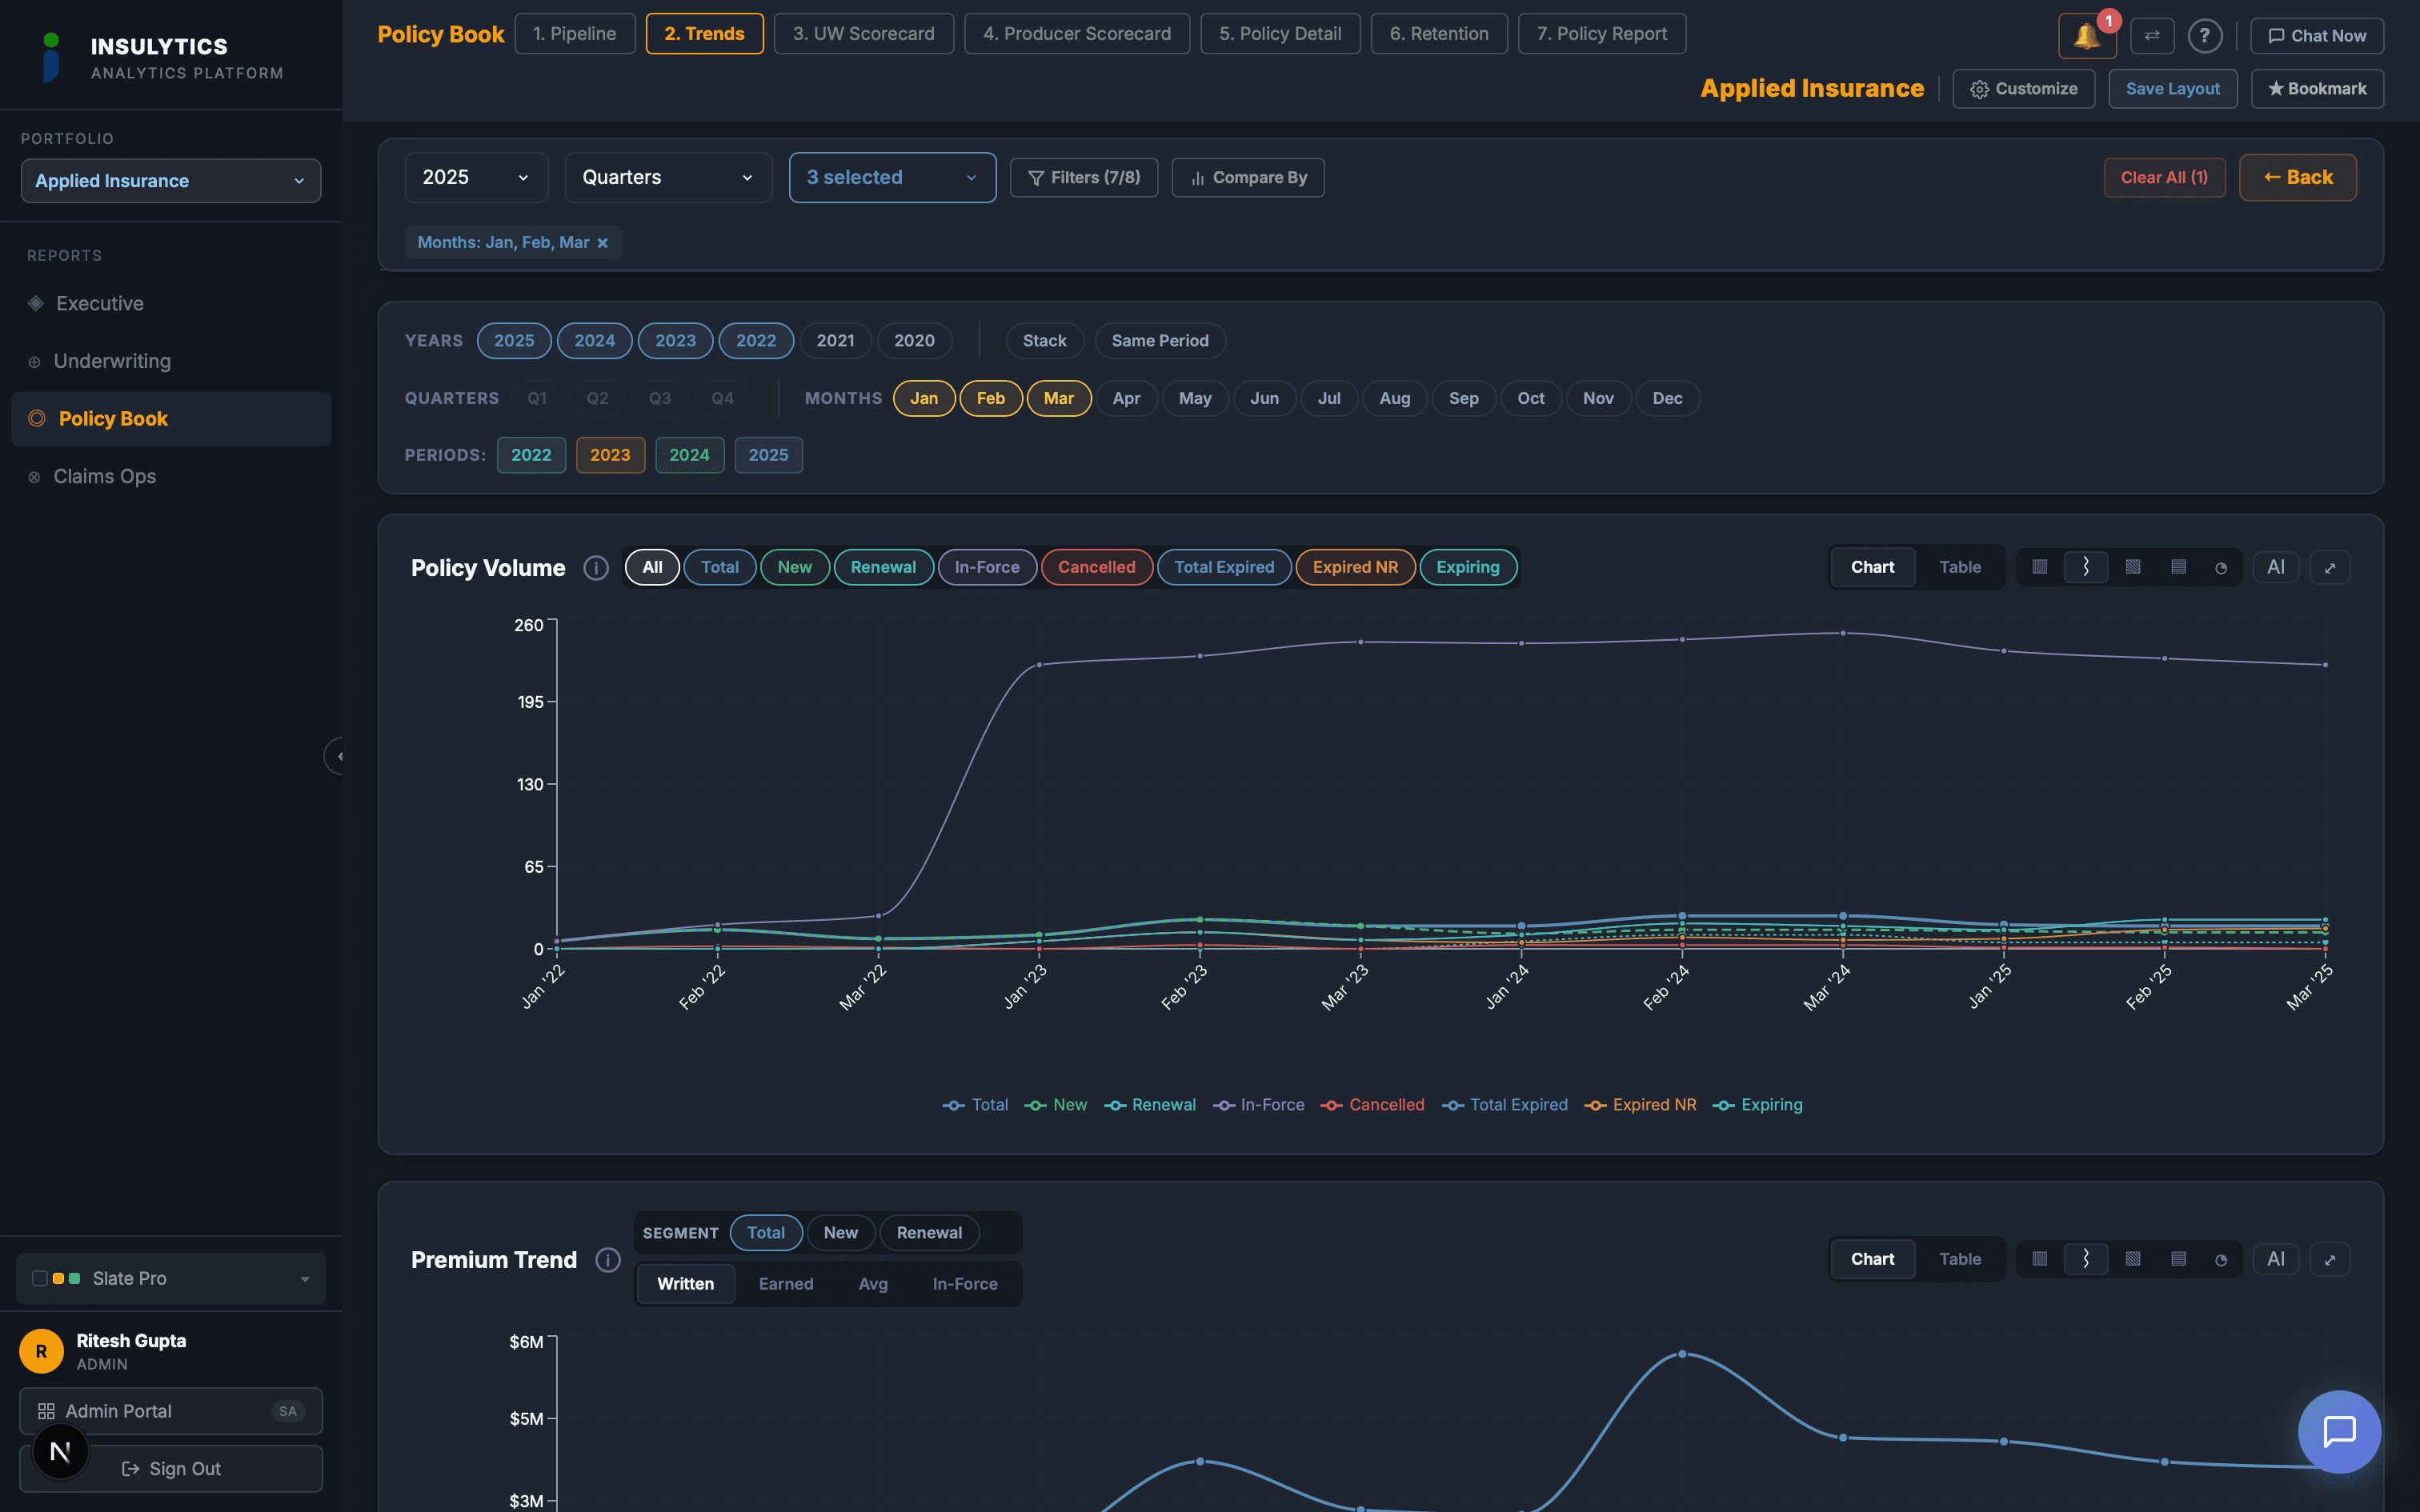
Policy Trends
Premium growth, retention rates, and book composition over multi-year periods.
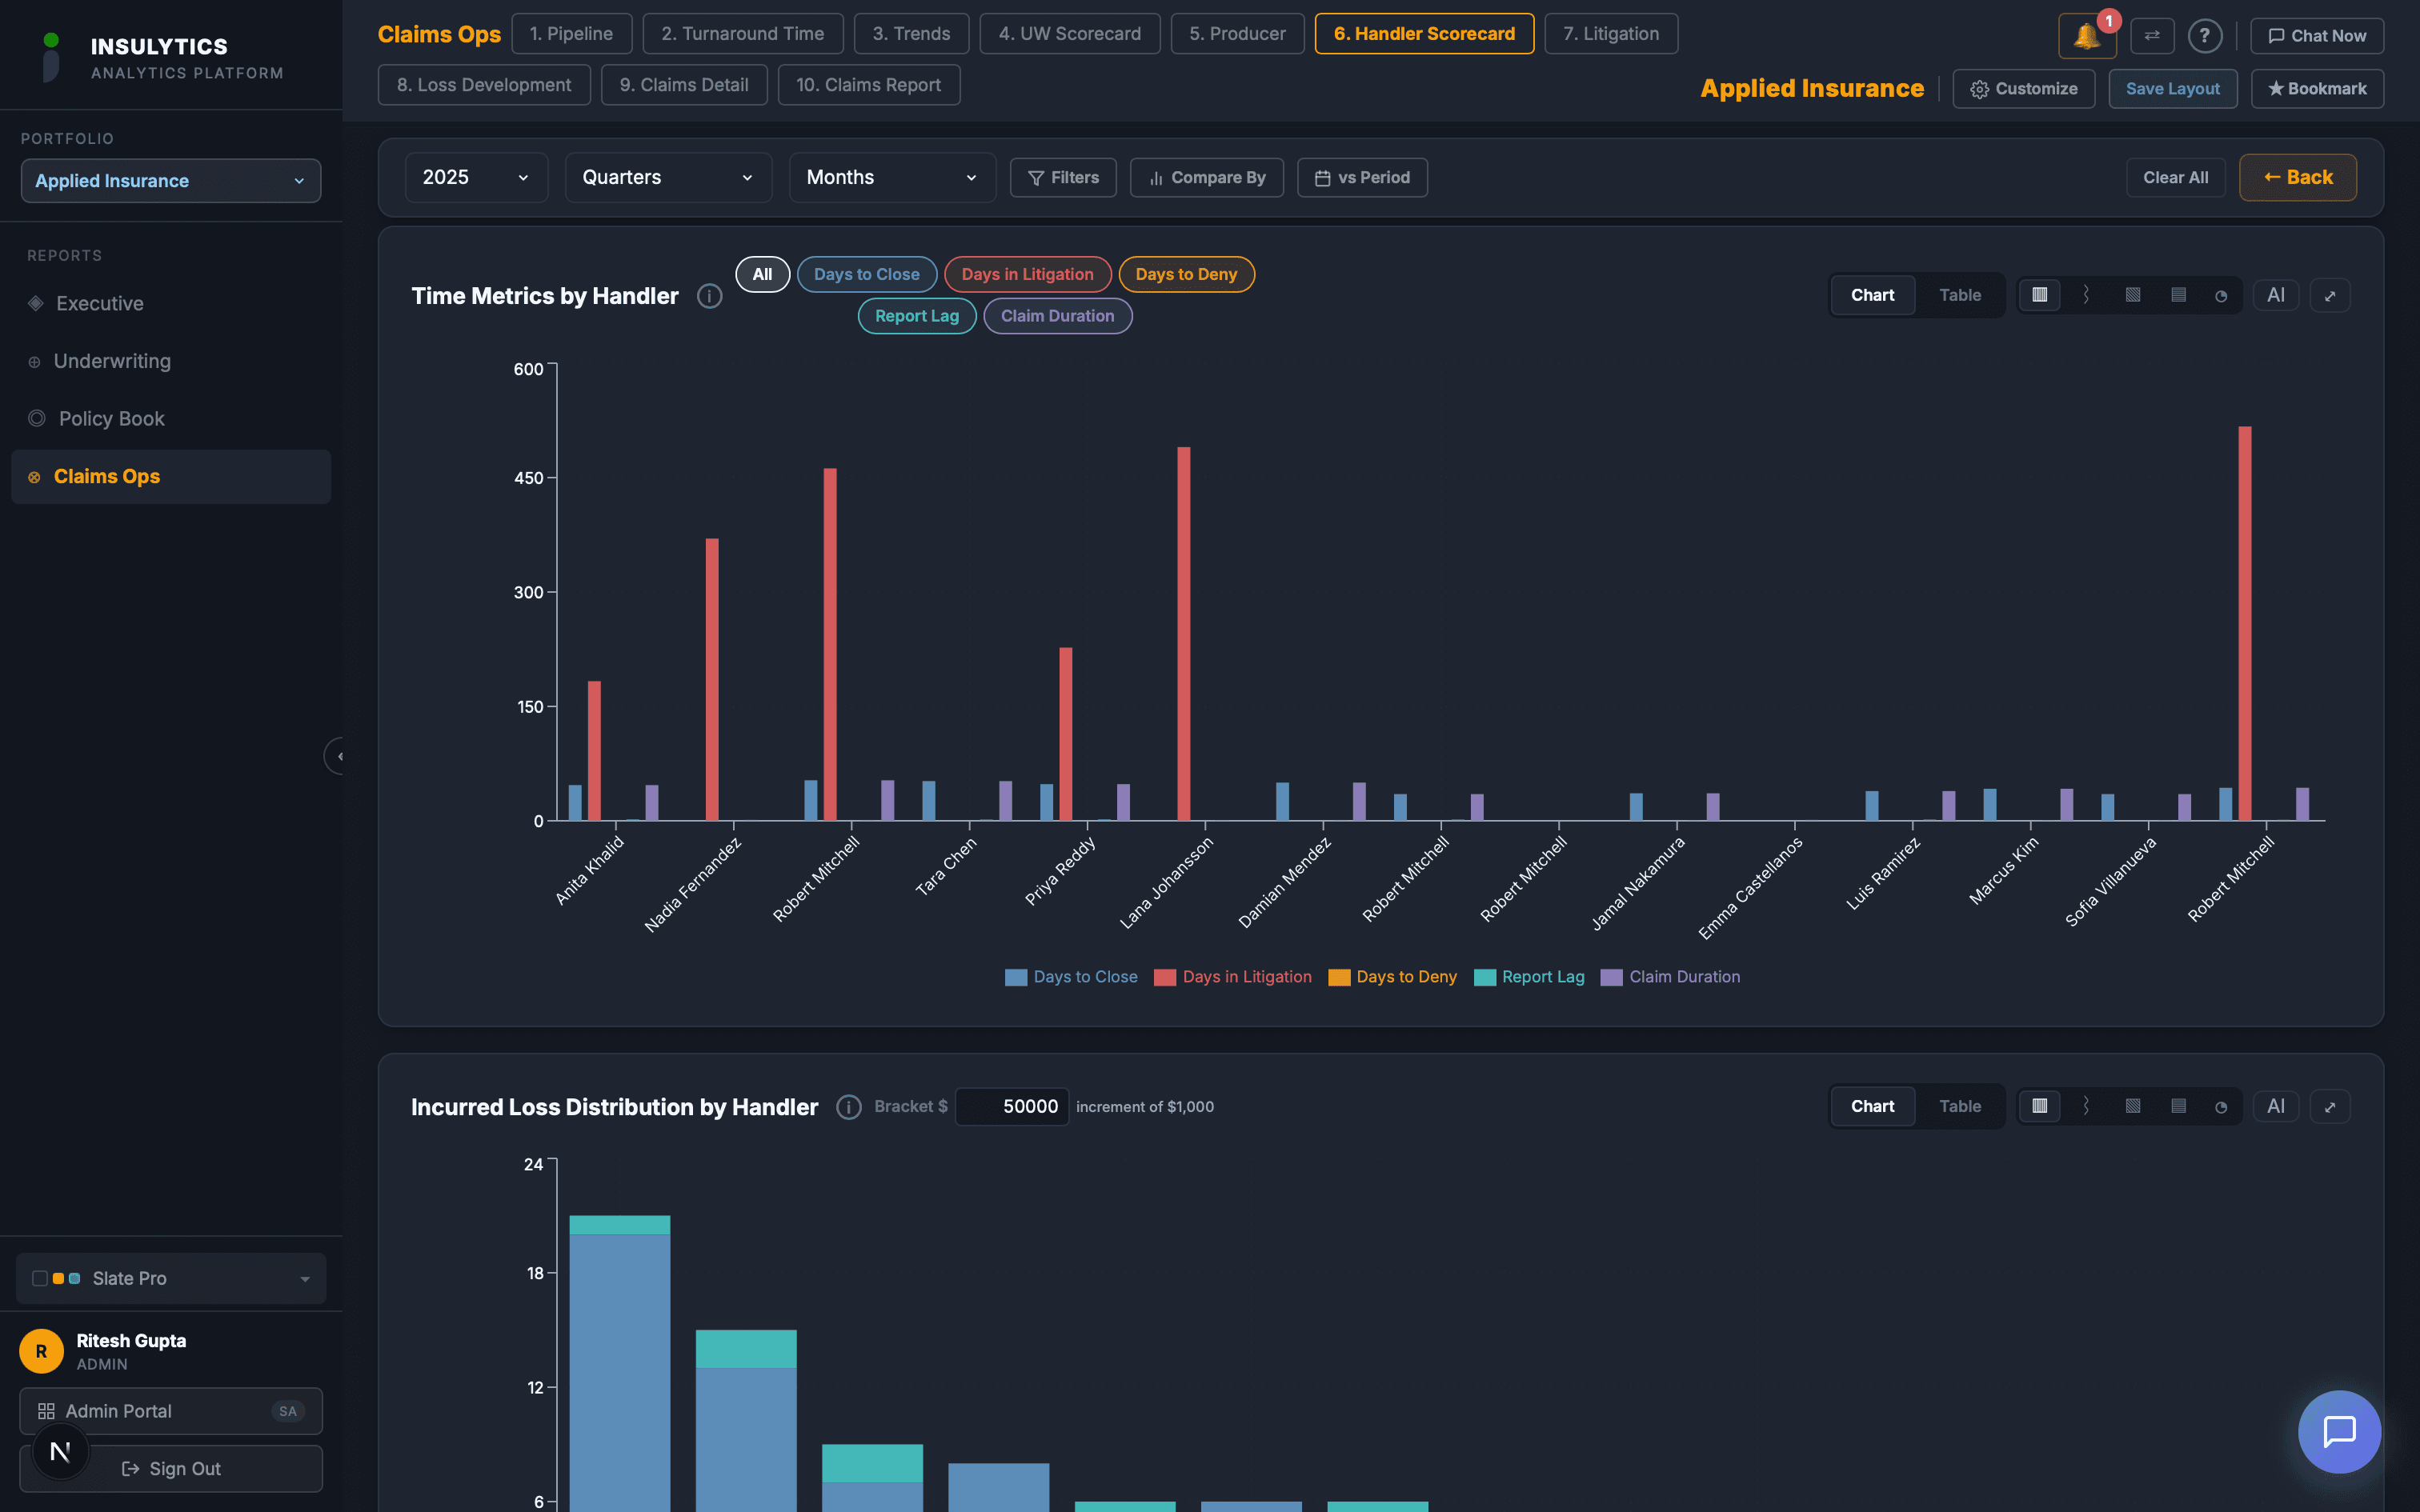
Handler Scorecard
Claims handler efficiency metrics with caseload tracking and productivity analysis.
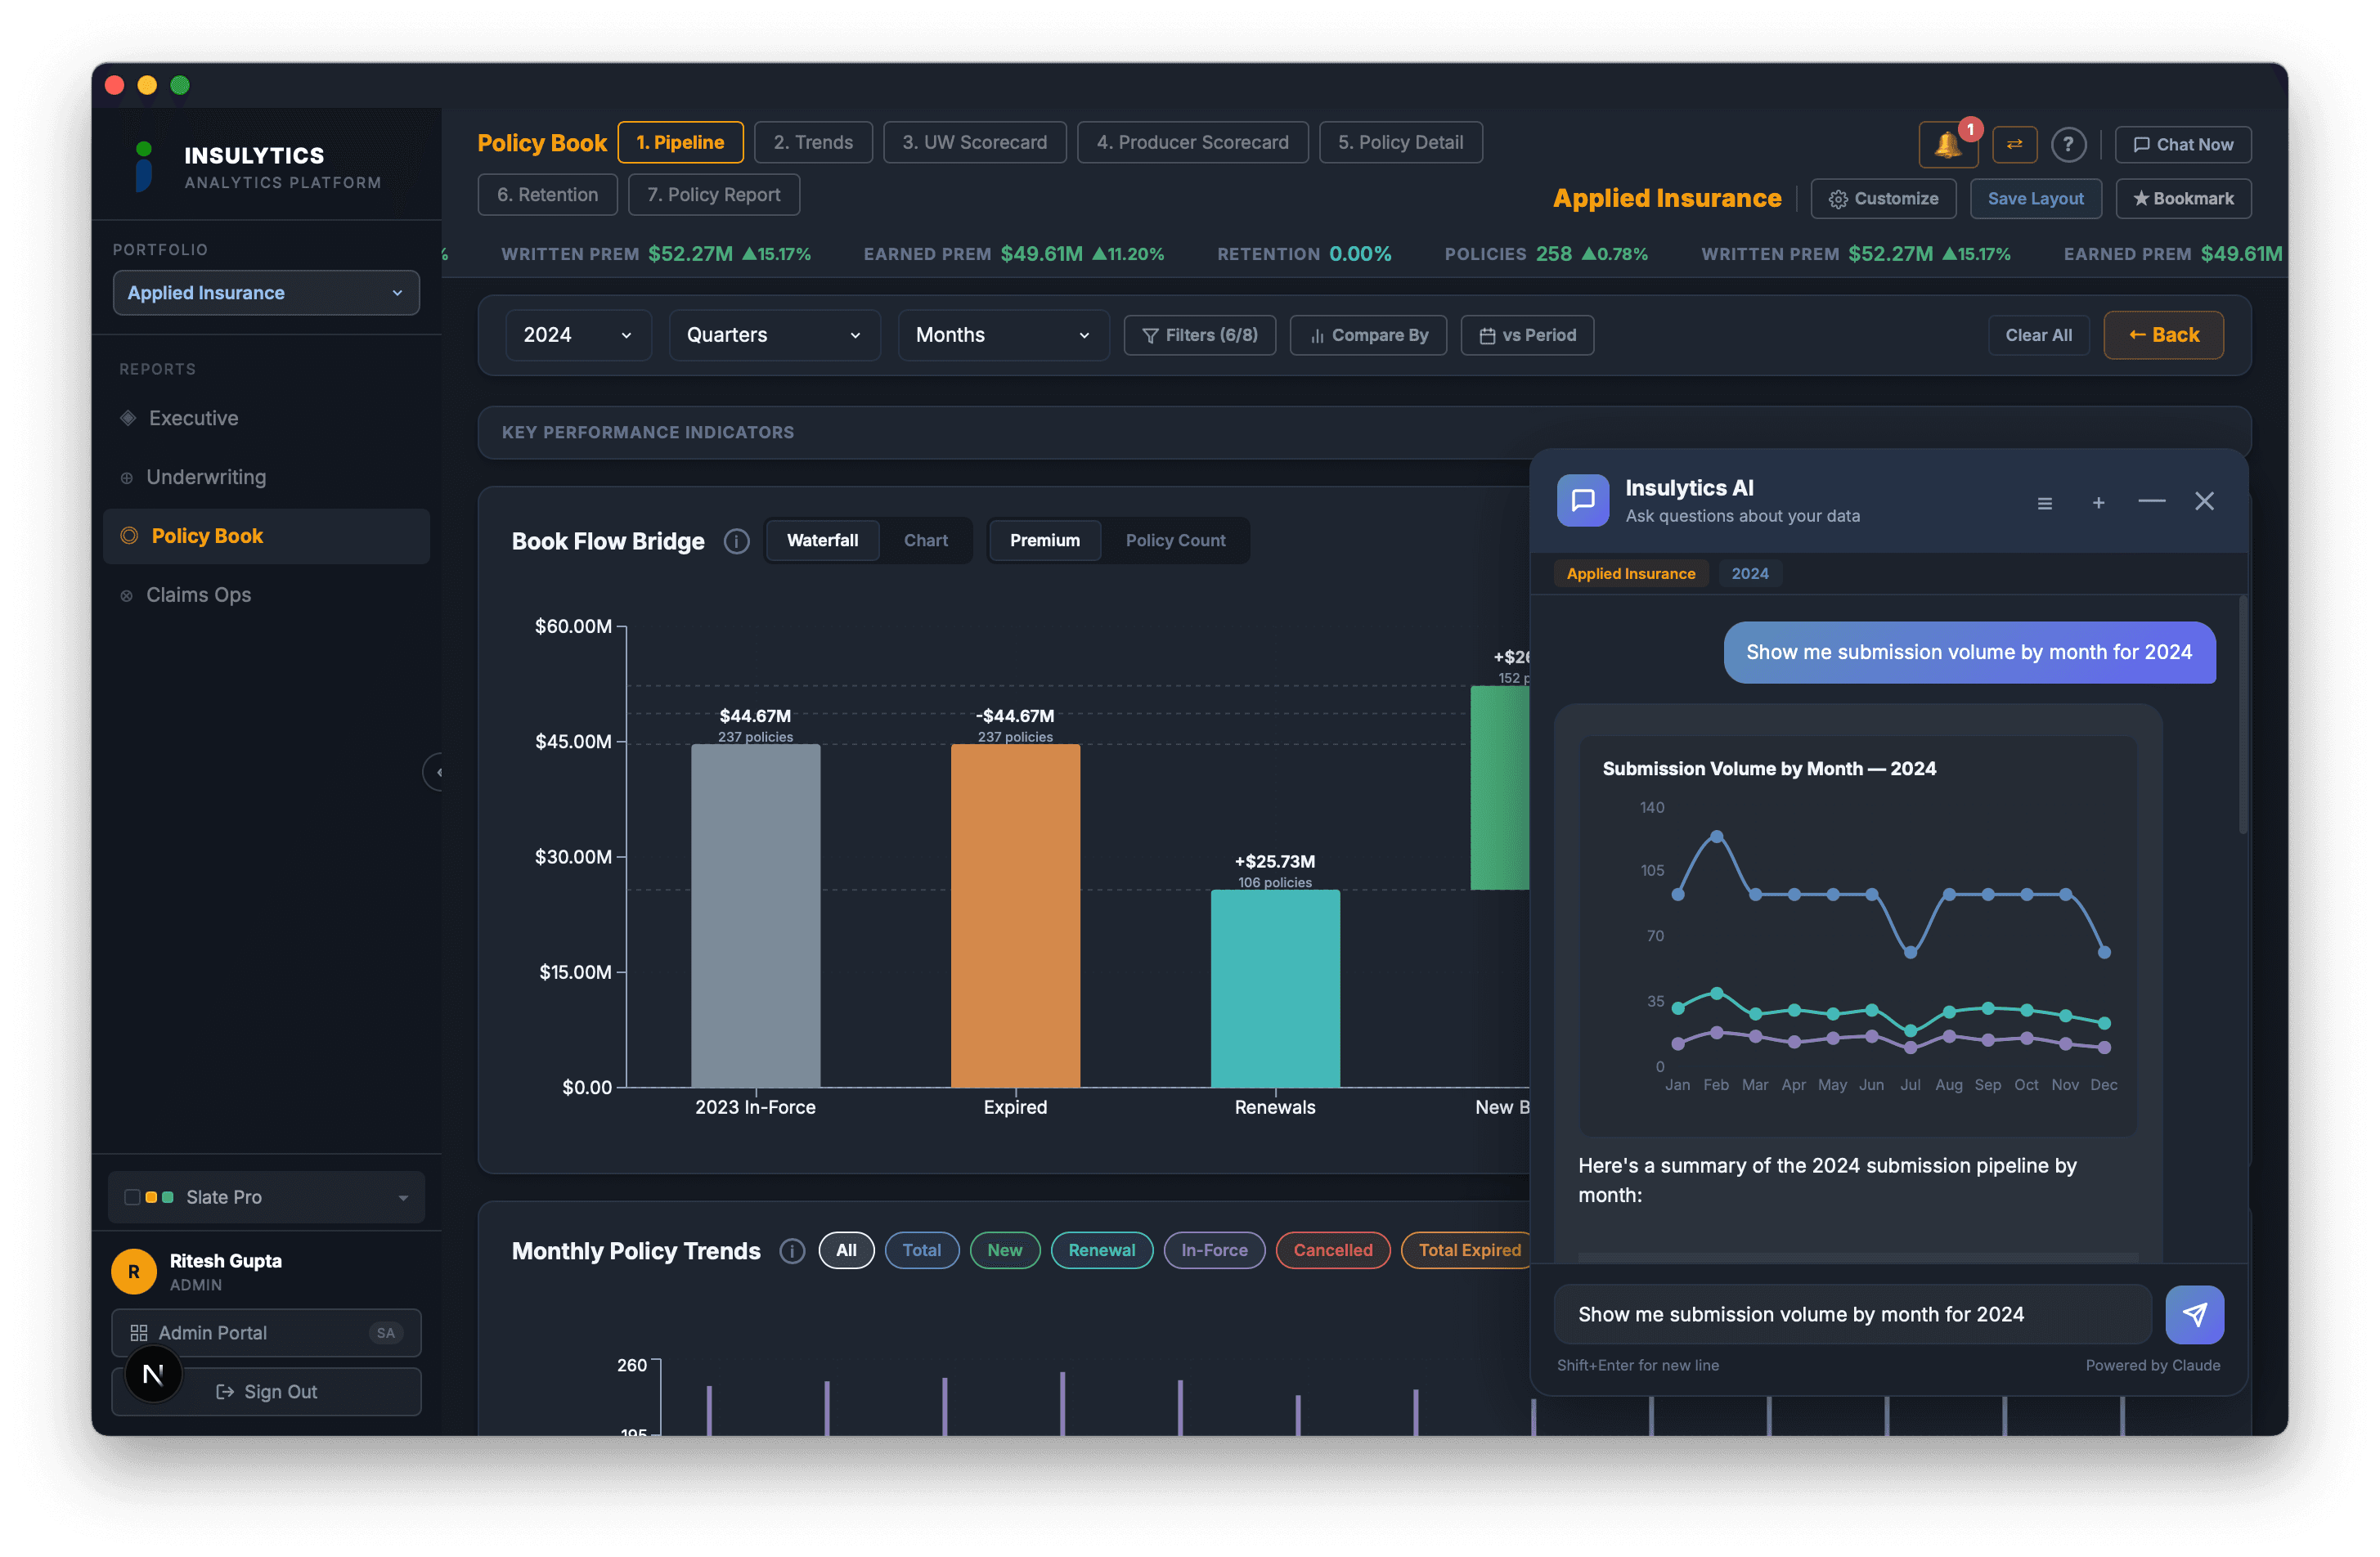
Insulytics AI
Ask questions about your book in plain English — get charts, reports, and KPI alerts instantly.
Measurable Impact
Average loss ratio improvement within 12 months
Faster underwriting decisions with automated pipeline data
Average policy retention rate with renewal analytics
Self-service analytics — no SQL or technical skills required
Ready to Optimize Your Book?
Book a personalized demo and see your data transformed into actionable insights.