Everything You Need — All in One Place
Powered by Insulytics AI
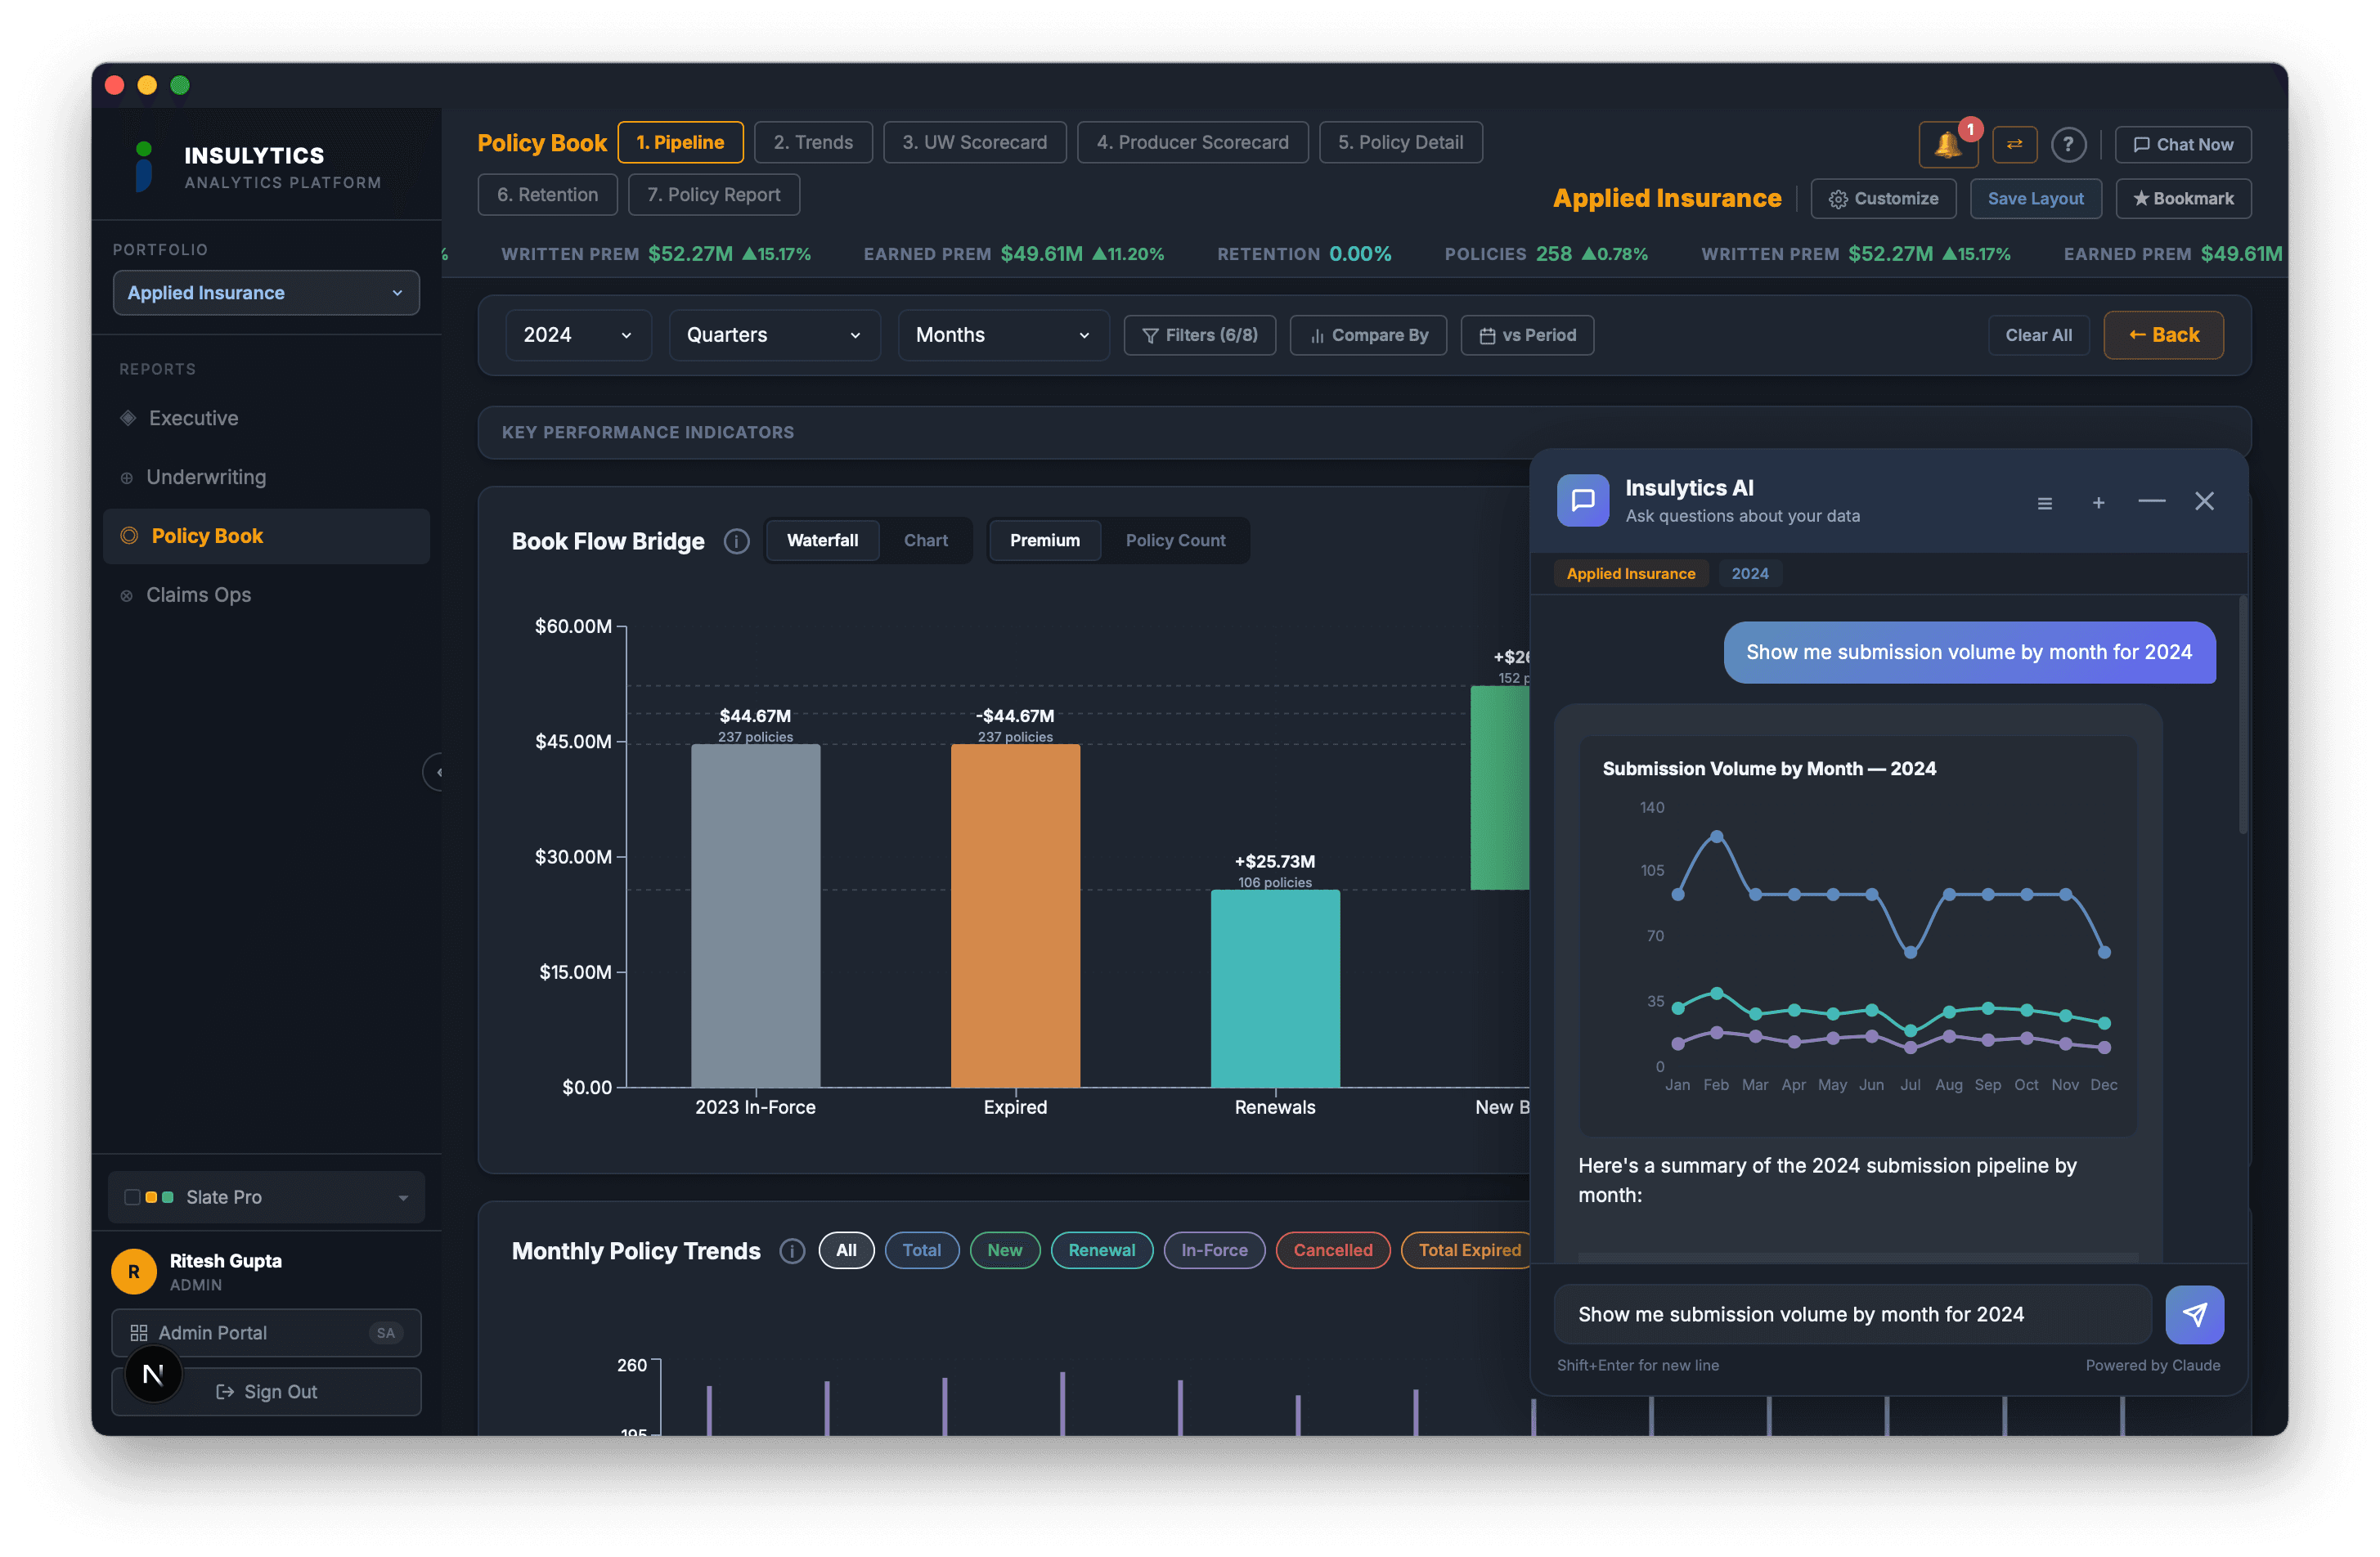
25+ interactive dashboards with YoY, QoQ, and MoM comparisons covering every aspect of your P&C operations. Plus, an AI analyst that lets any user ask questions, generate charts, and build reports — no SQL or technical skills required.
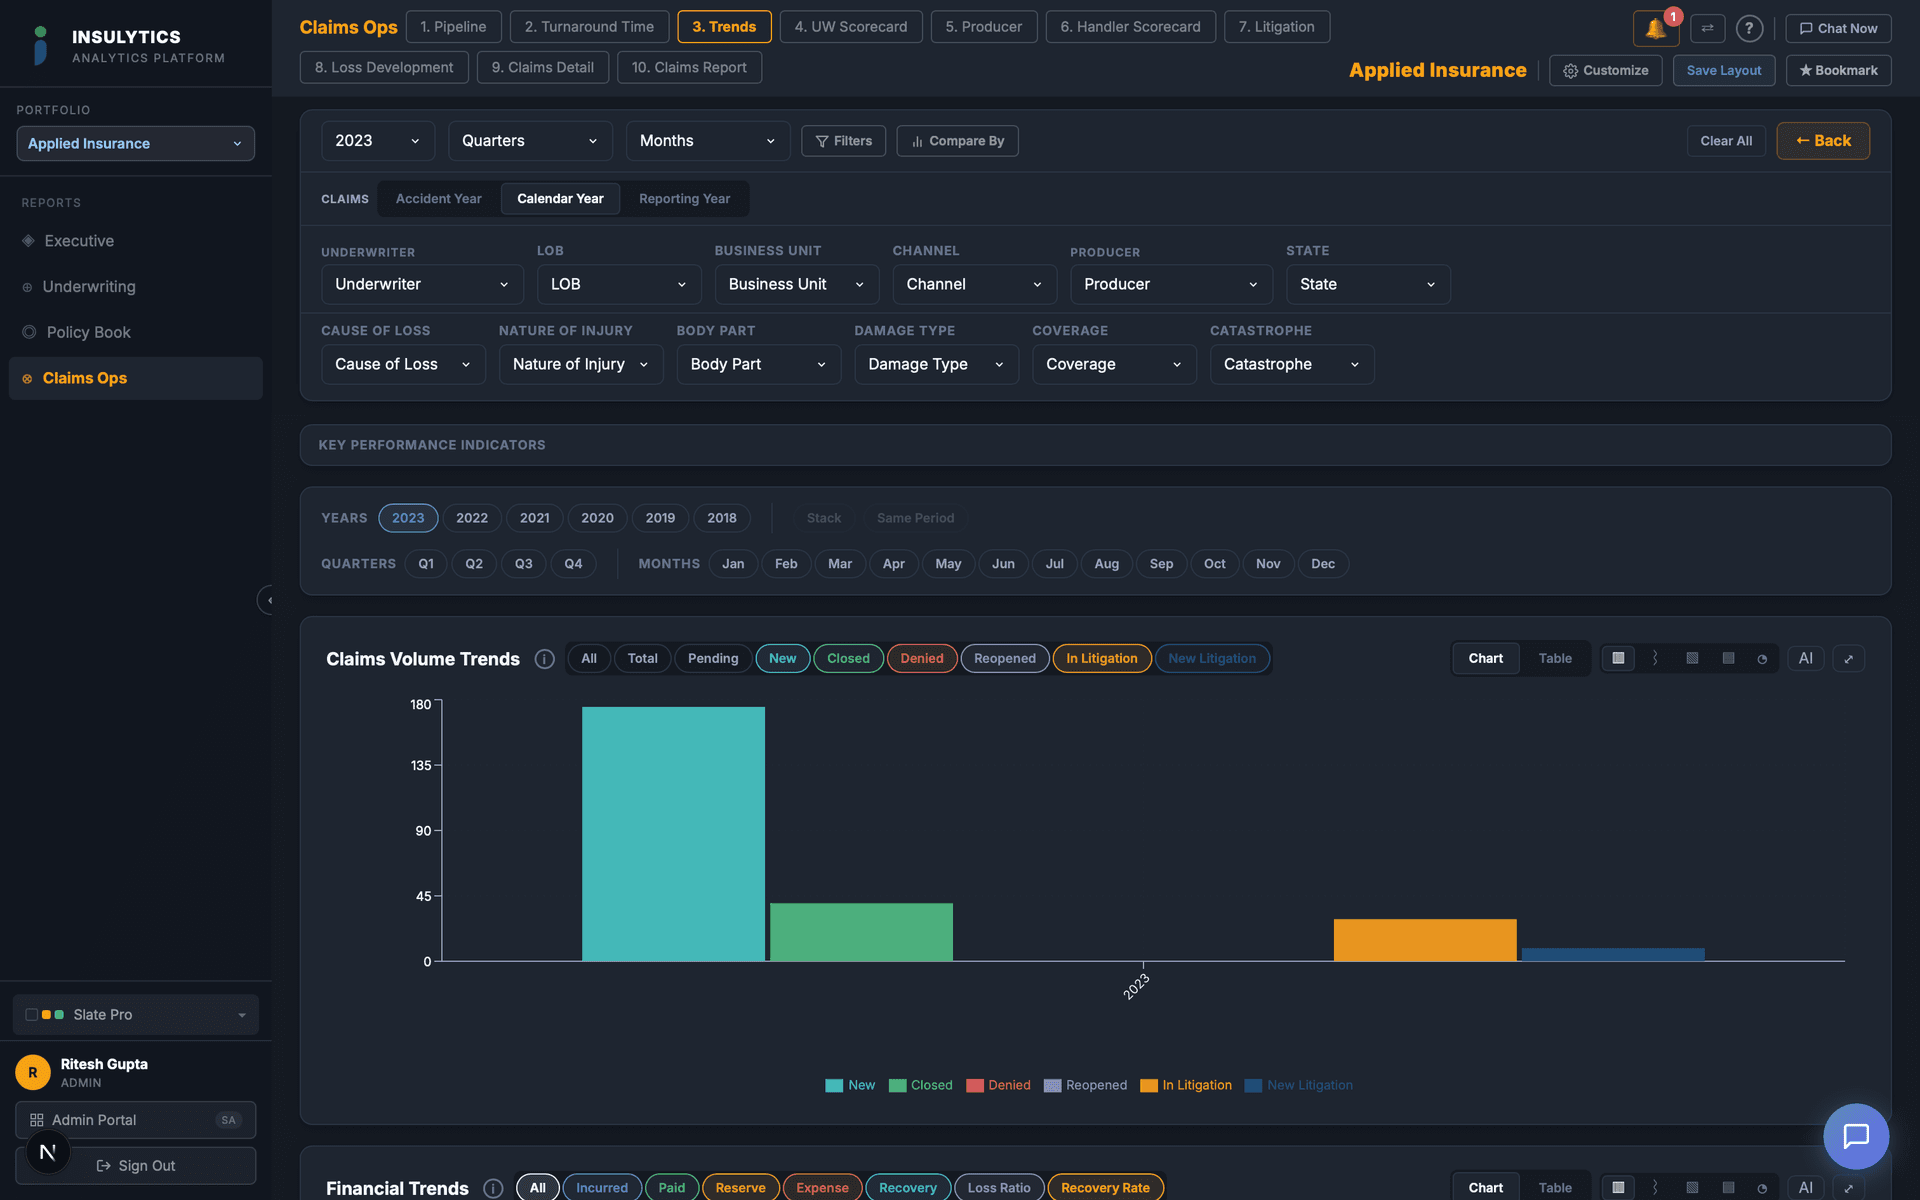
Dimension Filters
Filter by Underwriter, LOB, Producer, State, and more
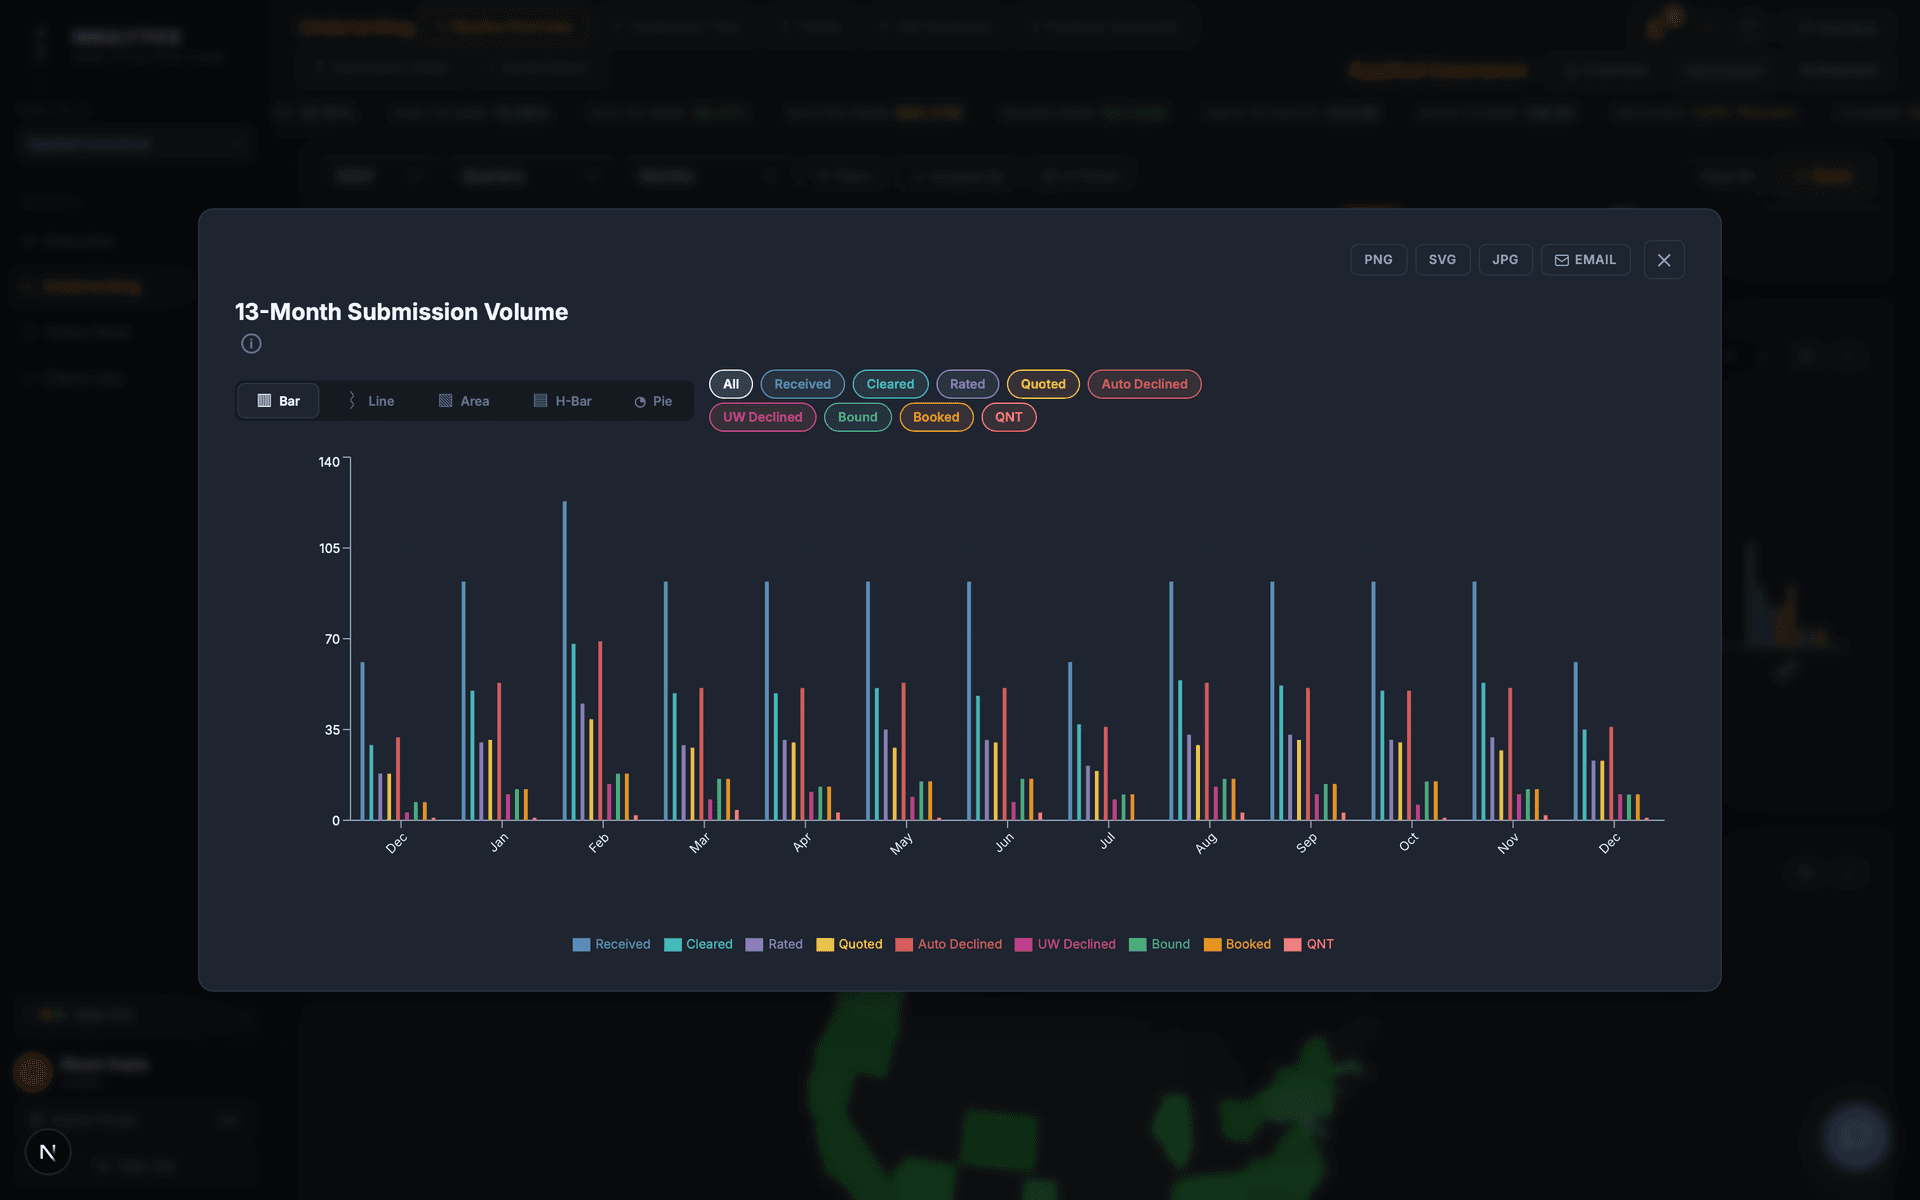
Chart Type Switching
Toggle between bar, line, area, horizontal bar, and pie
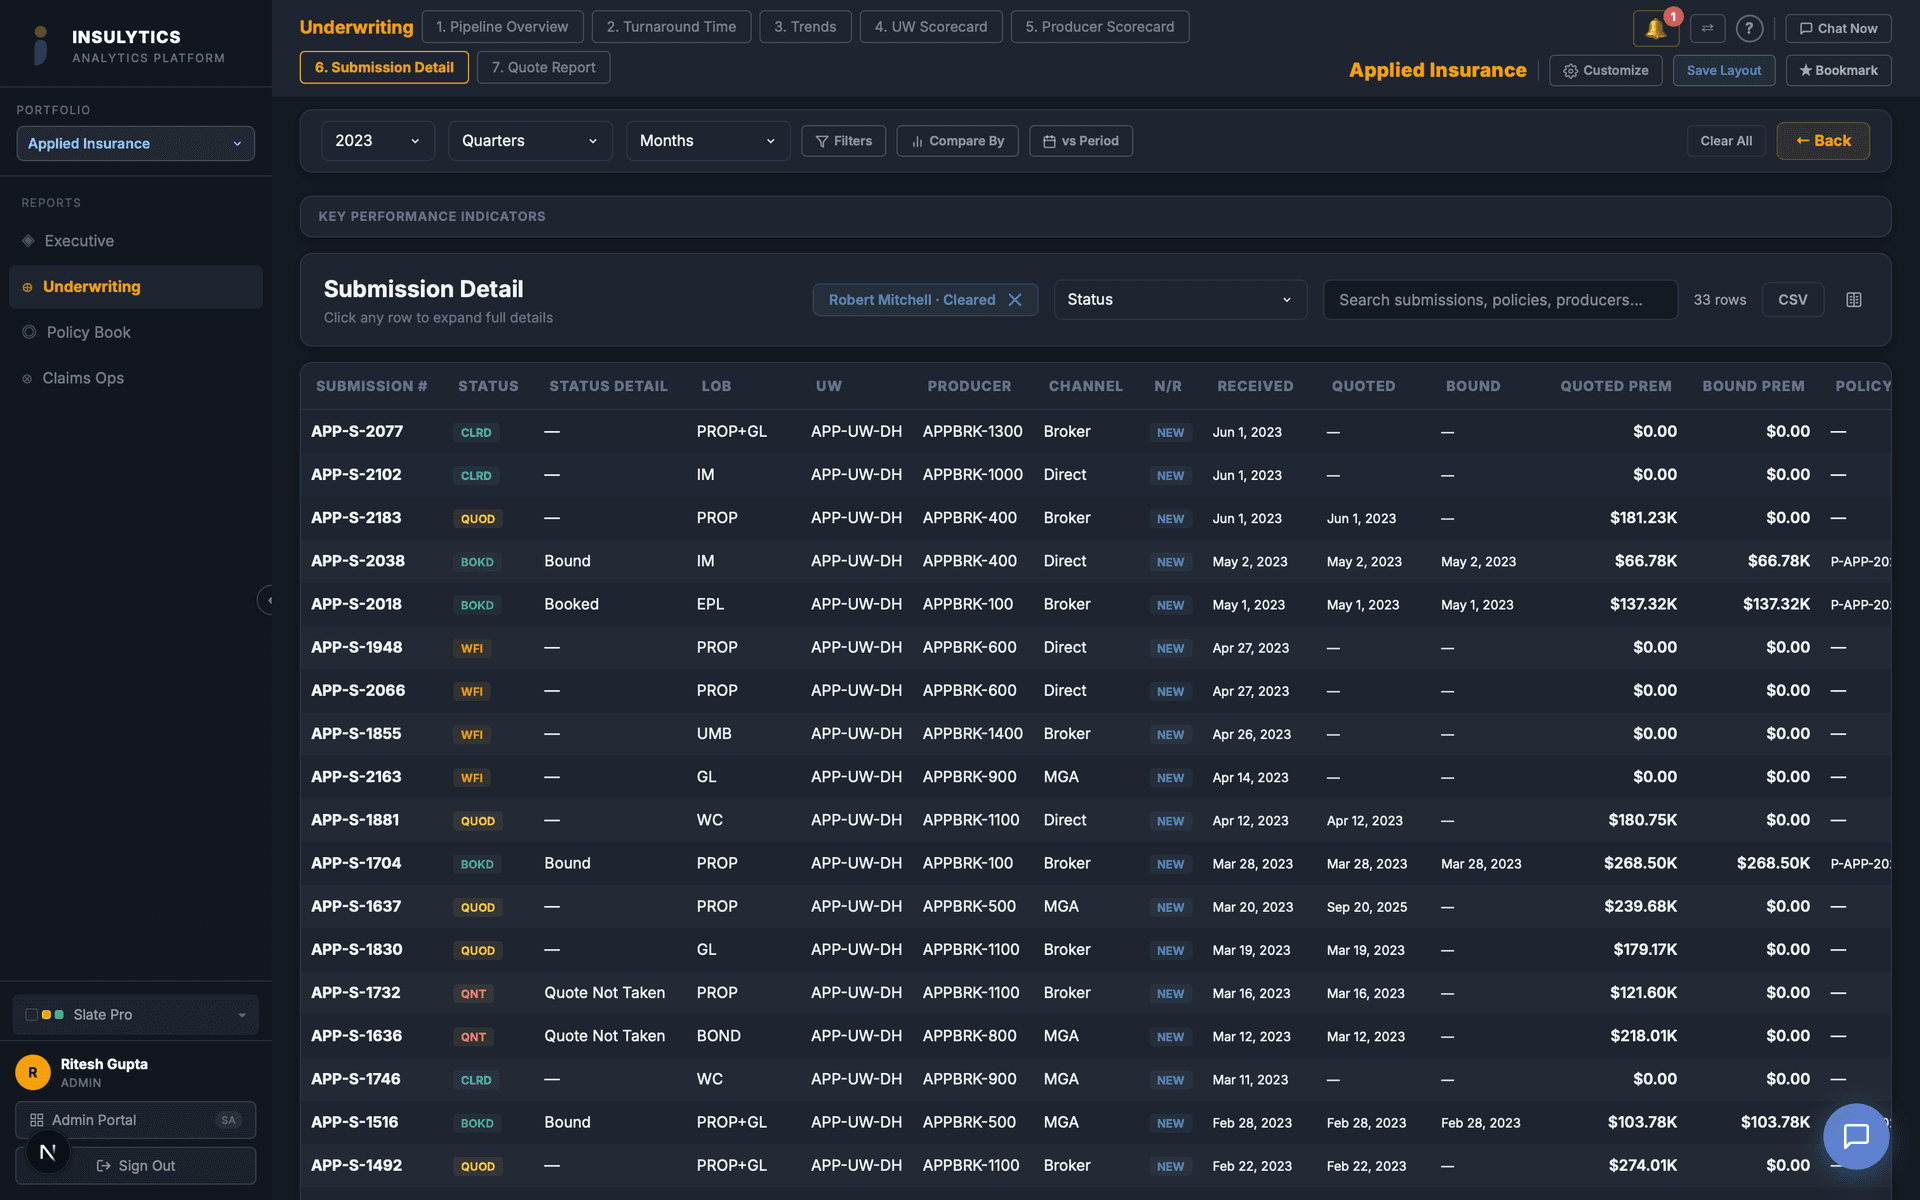
Full Drill-Down
Click any row to drill into detailed analytics
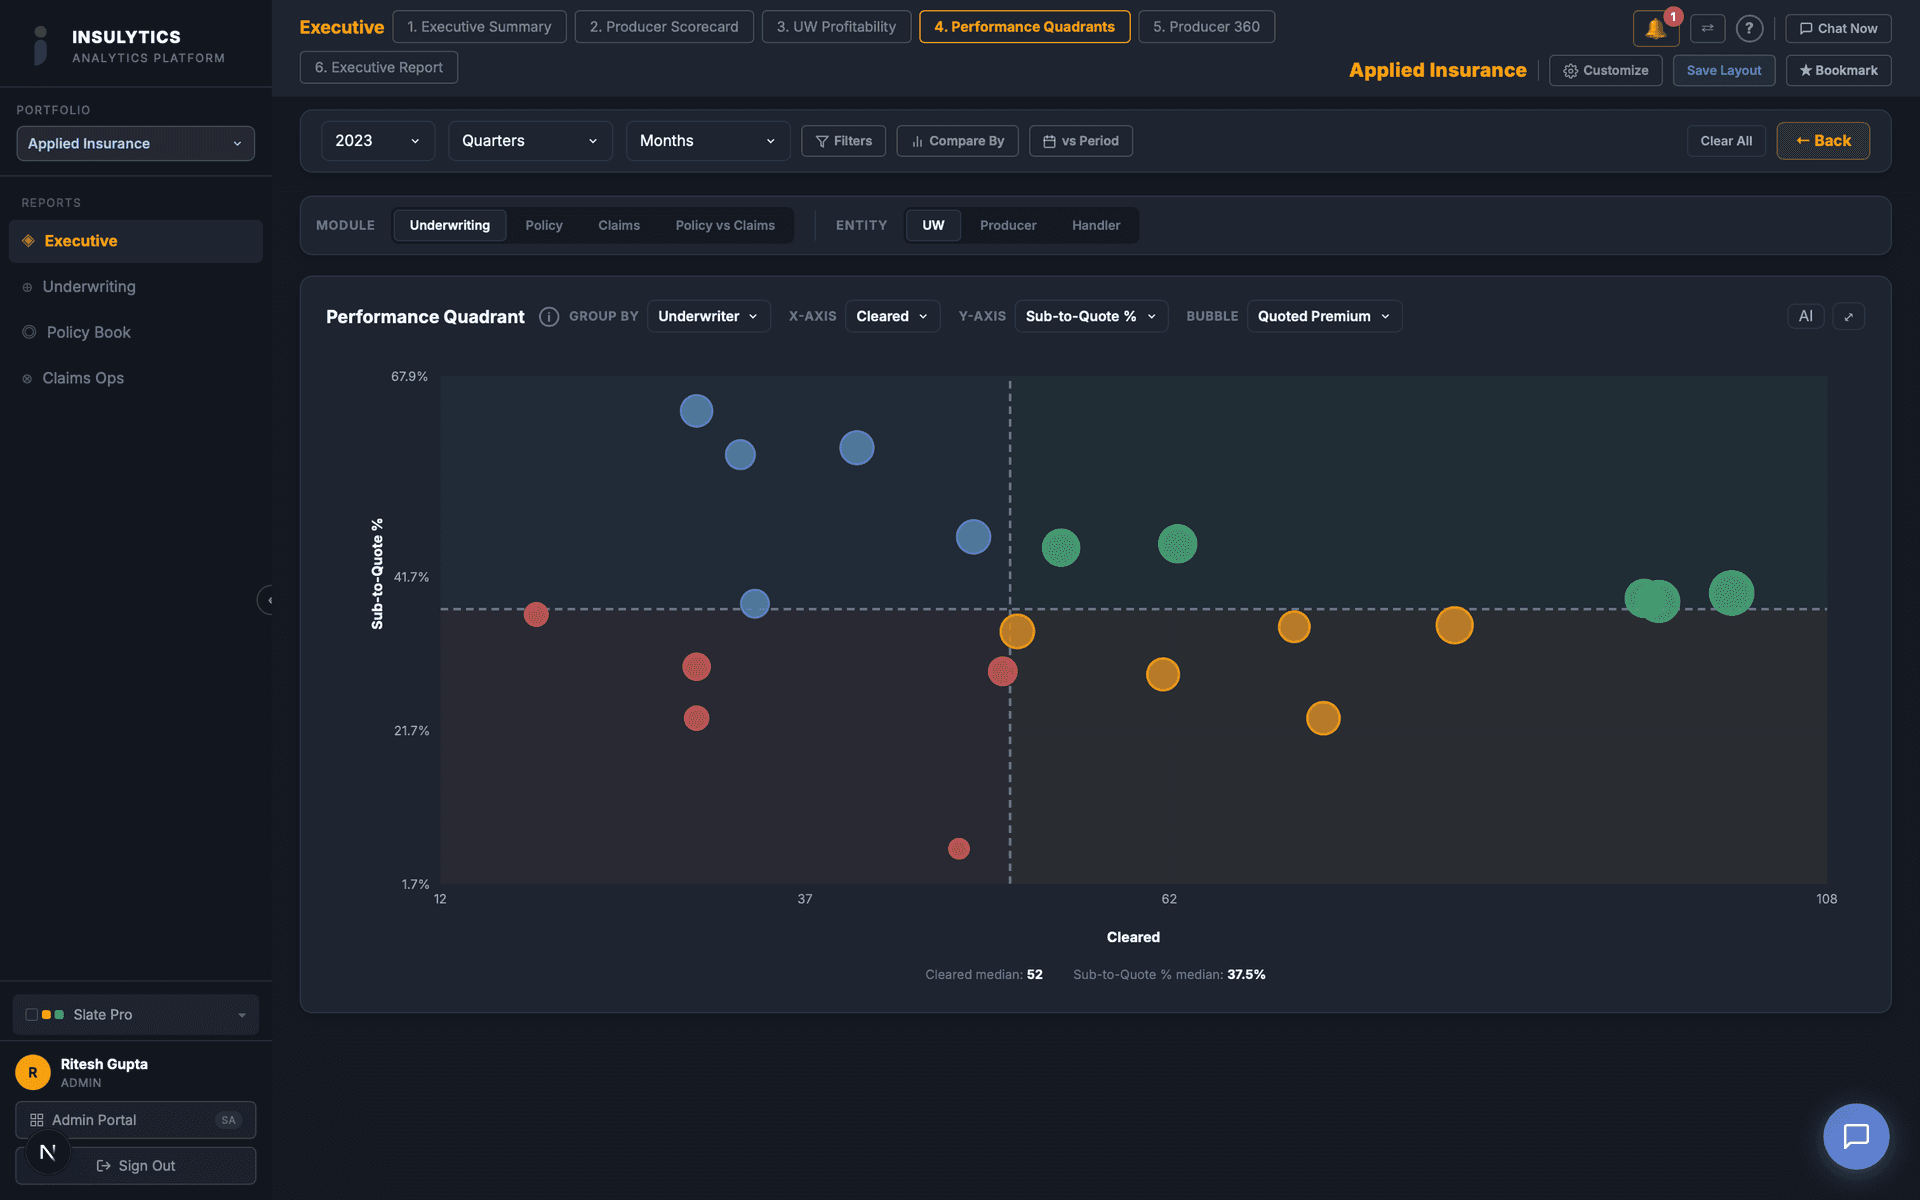
Merged Scorecards
4-module producer view — submissions, policies, claims, production
25+ Interactive Dashboards
Every dashboard features full drill-down, chart type switching, CSV export, and YoY / QoQ / MoM comparisons built in.
Executive
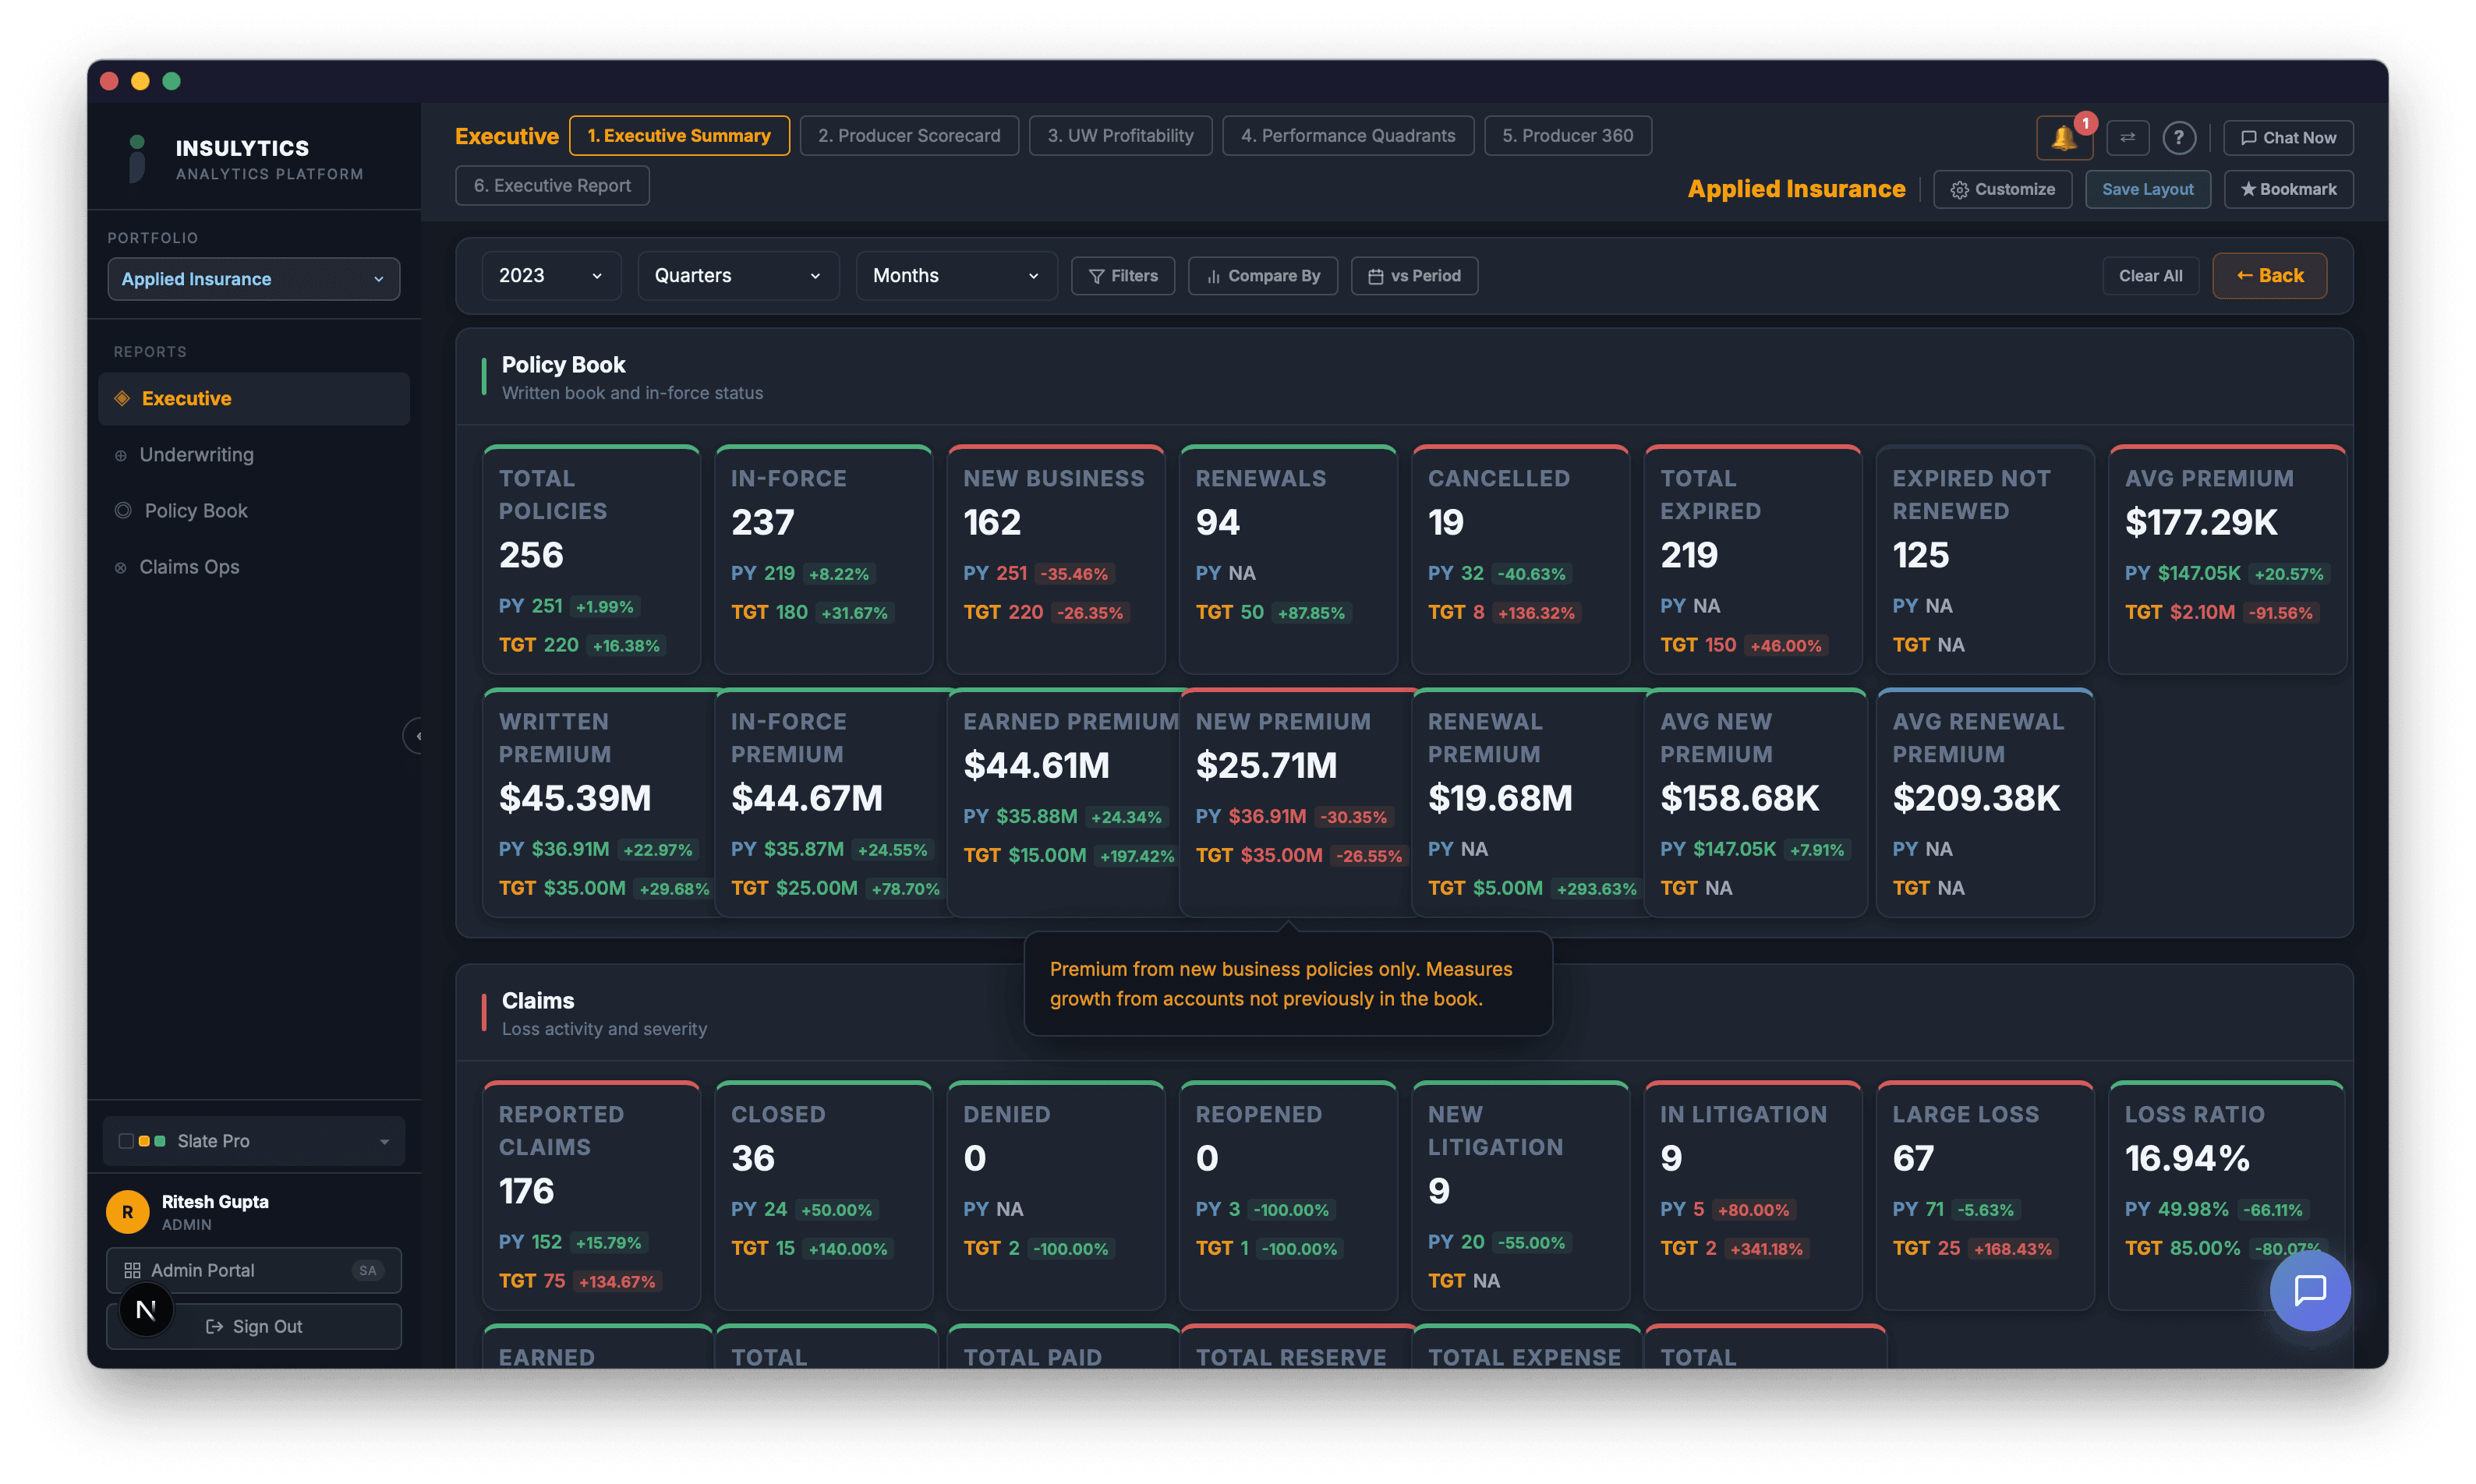
Executive Summary
Company-wide KPIs, trend analysis, and portfolio performance at a glance.
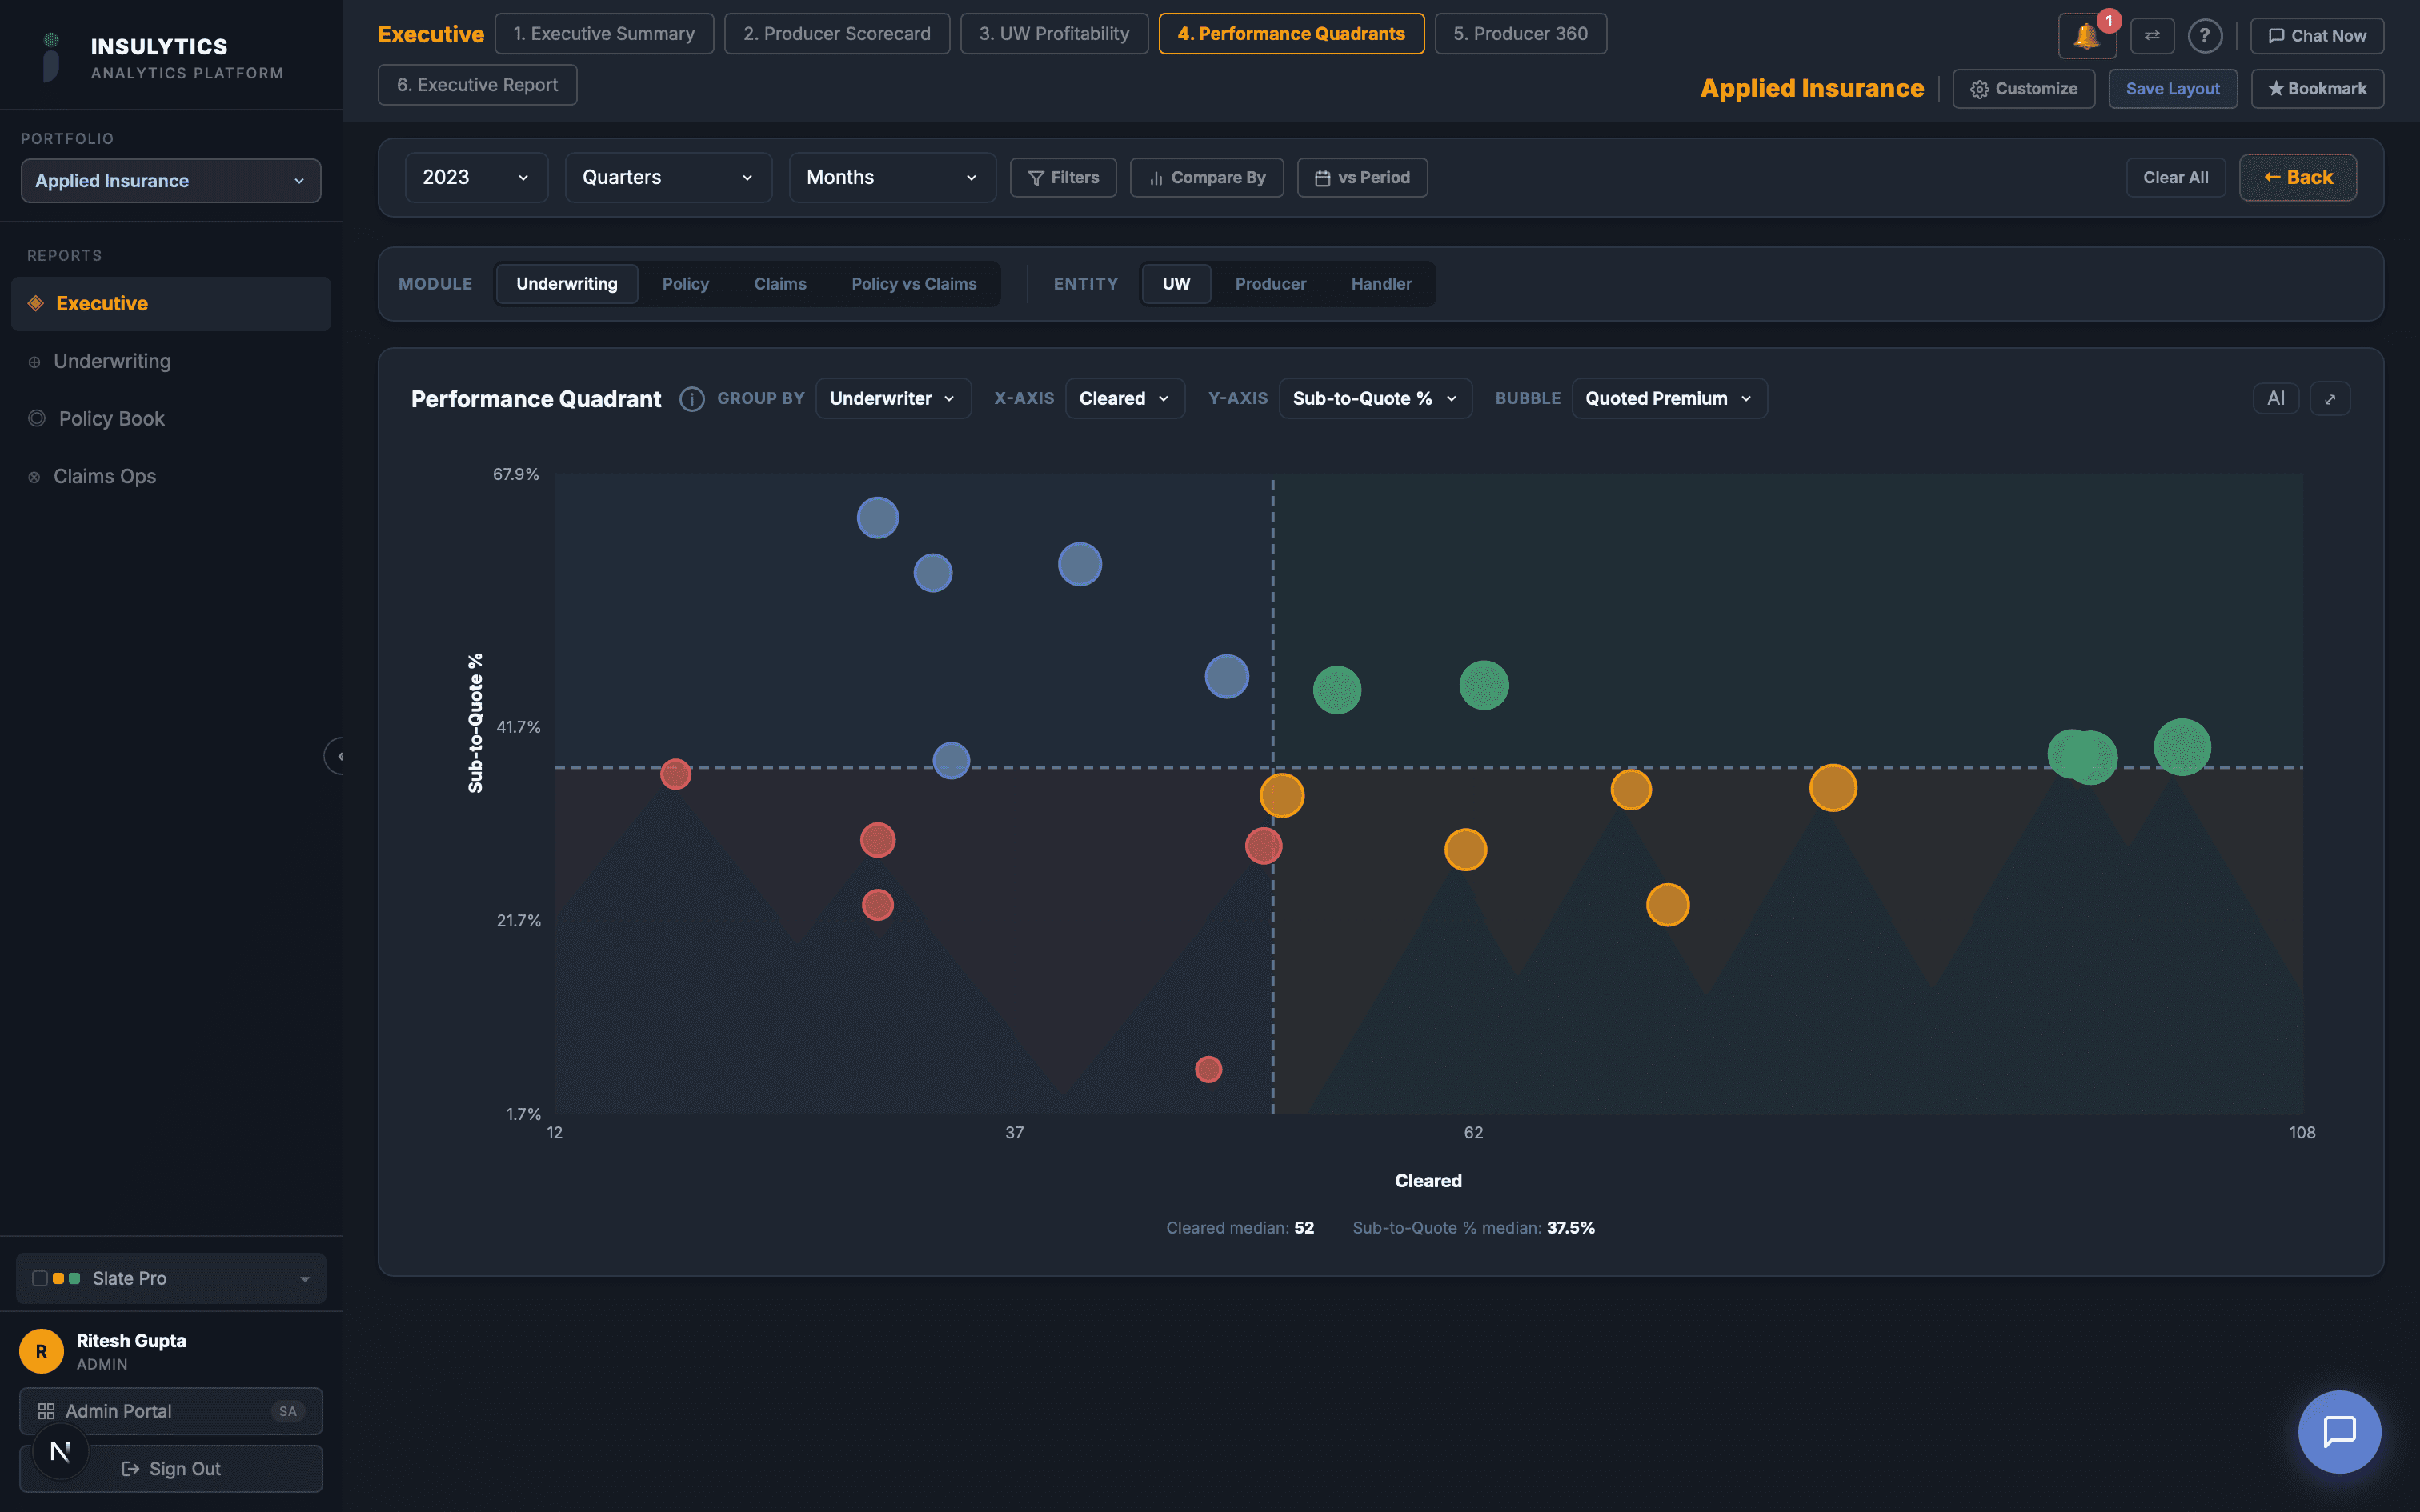
Executive Producer Scorecard
Merged 4-module scorecard — submissions, policies, claims, and production per producer.
Submissions & Quoting
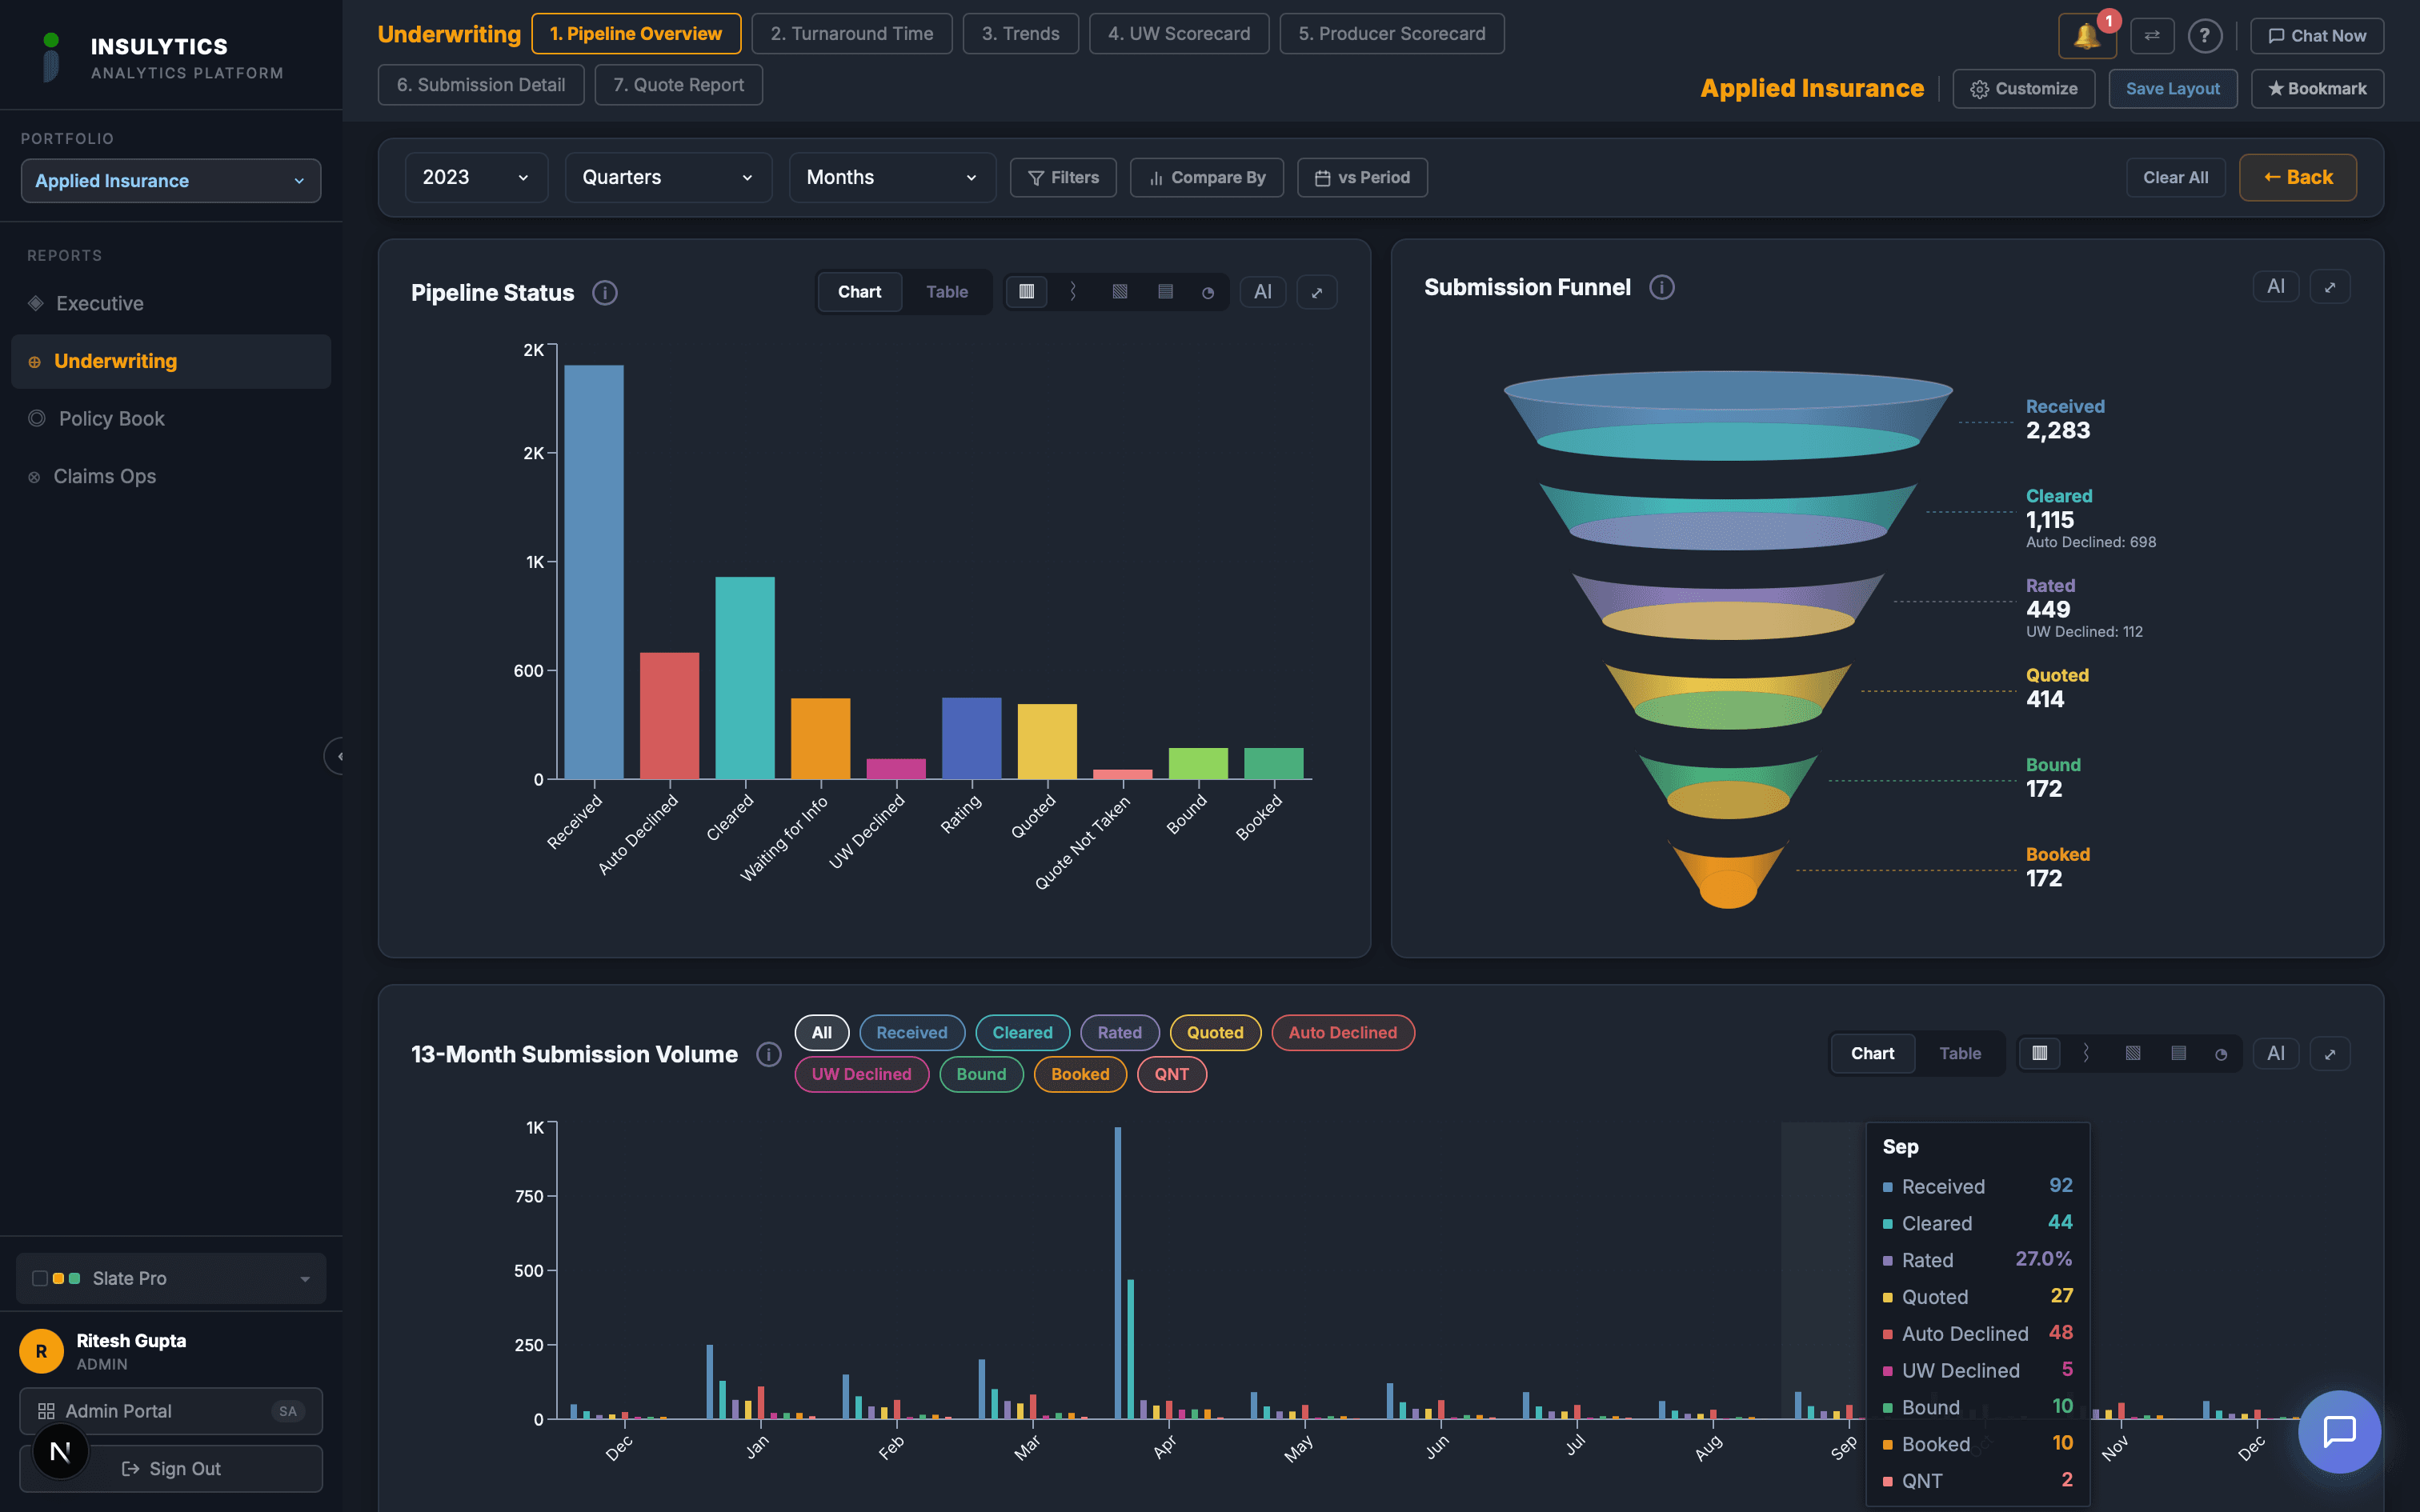
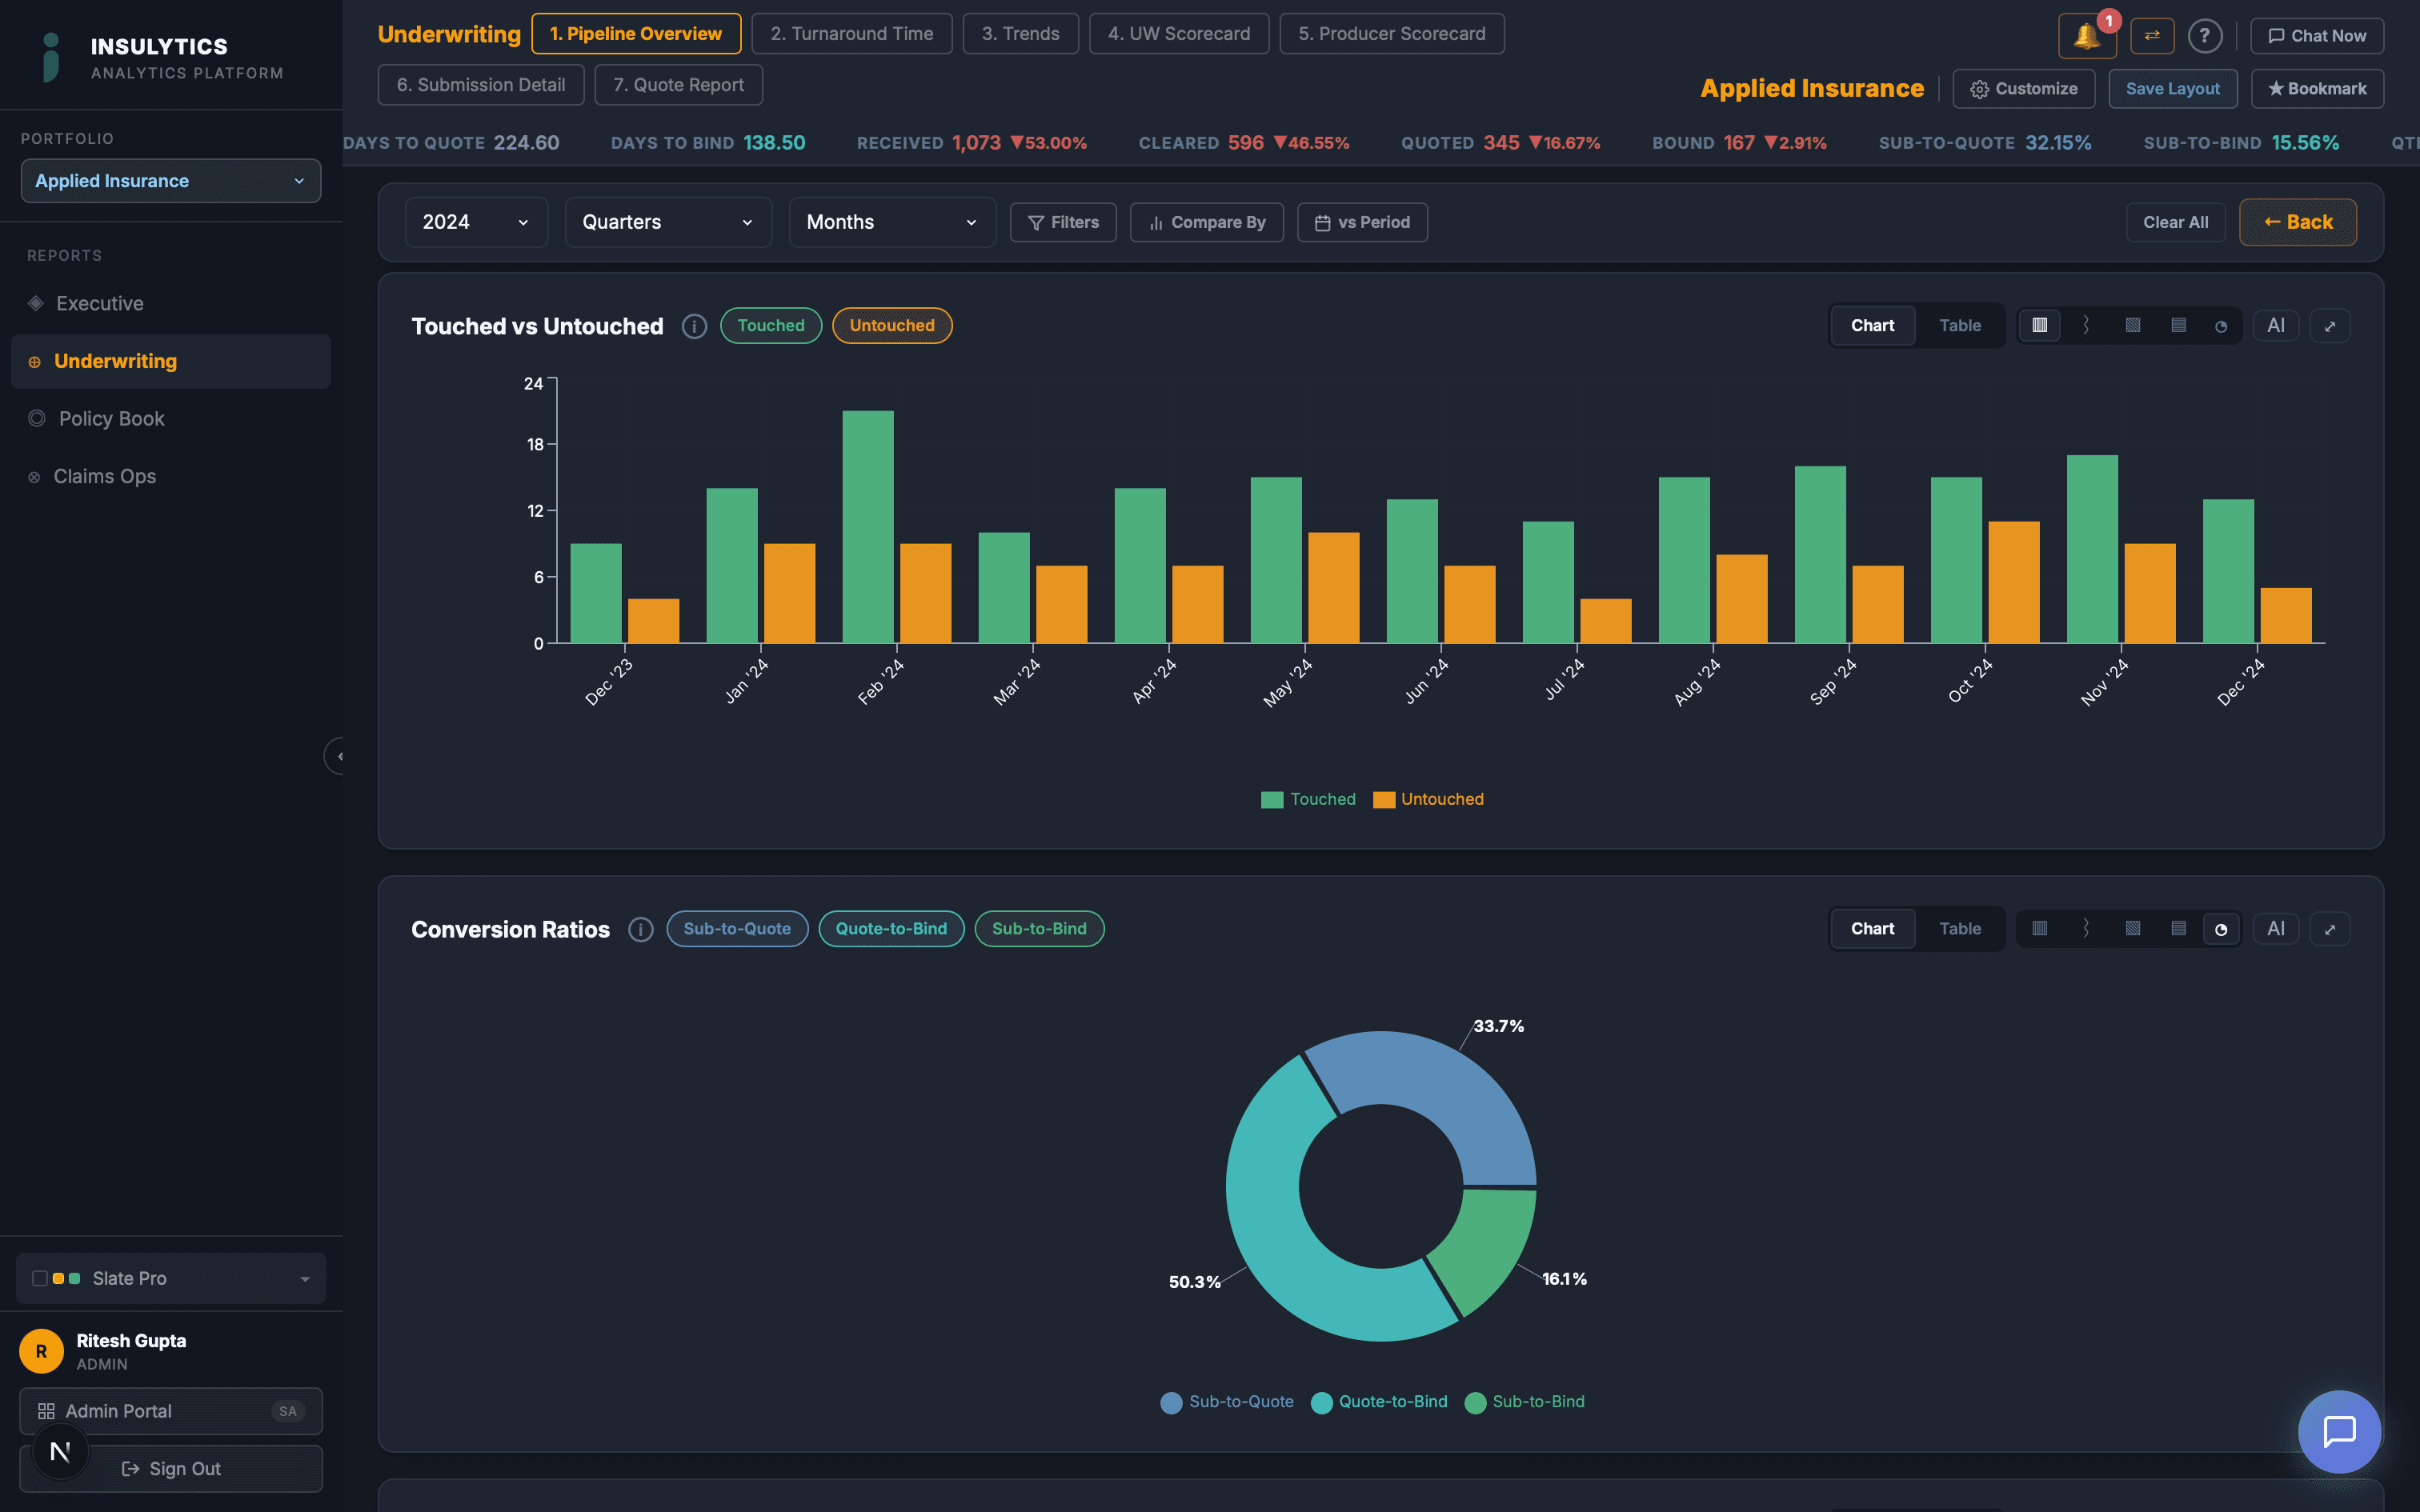
Submission Pipeline
End-to-end funnel from received to bound with conversion metrics at every stage.
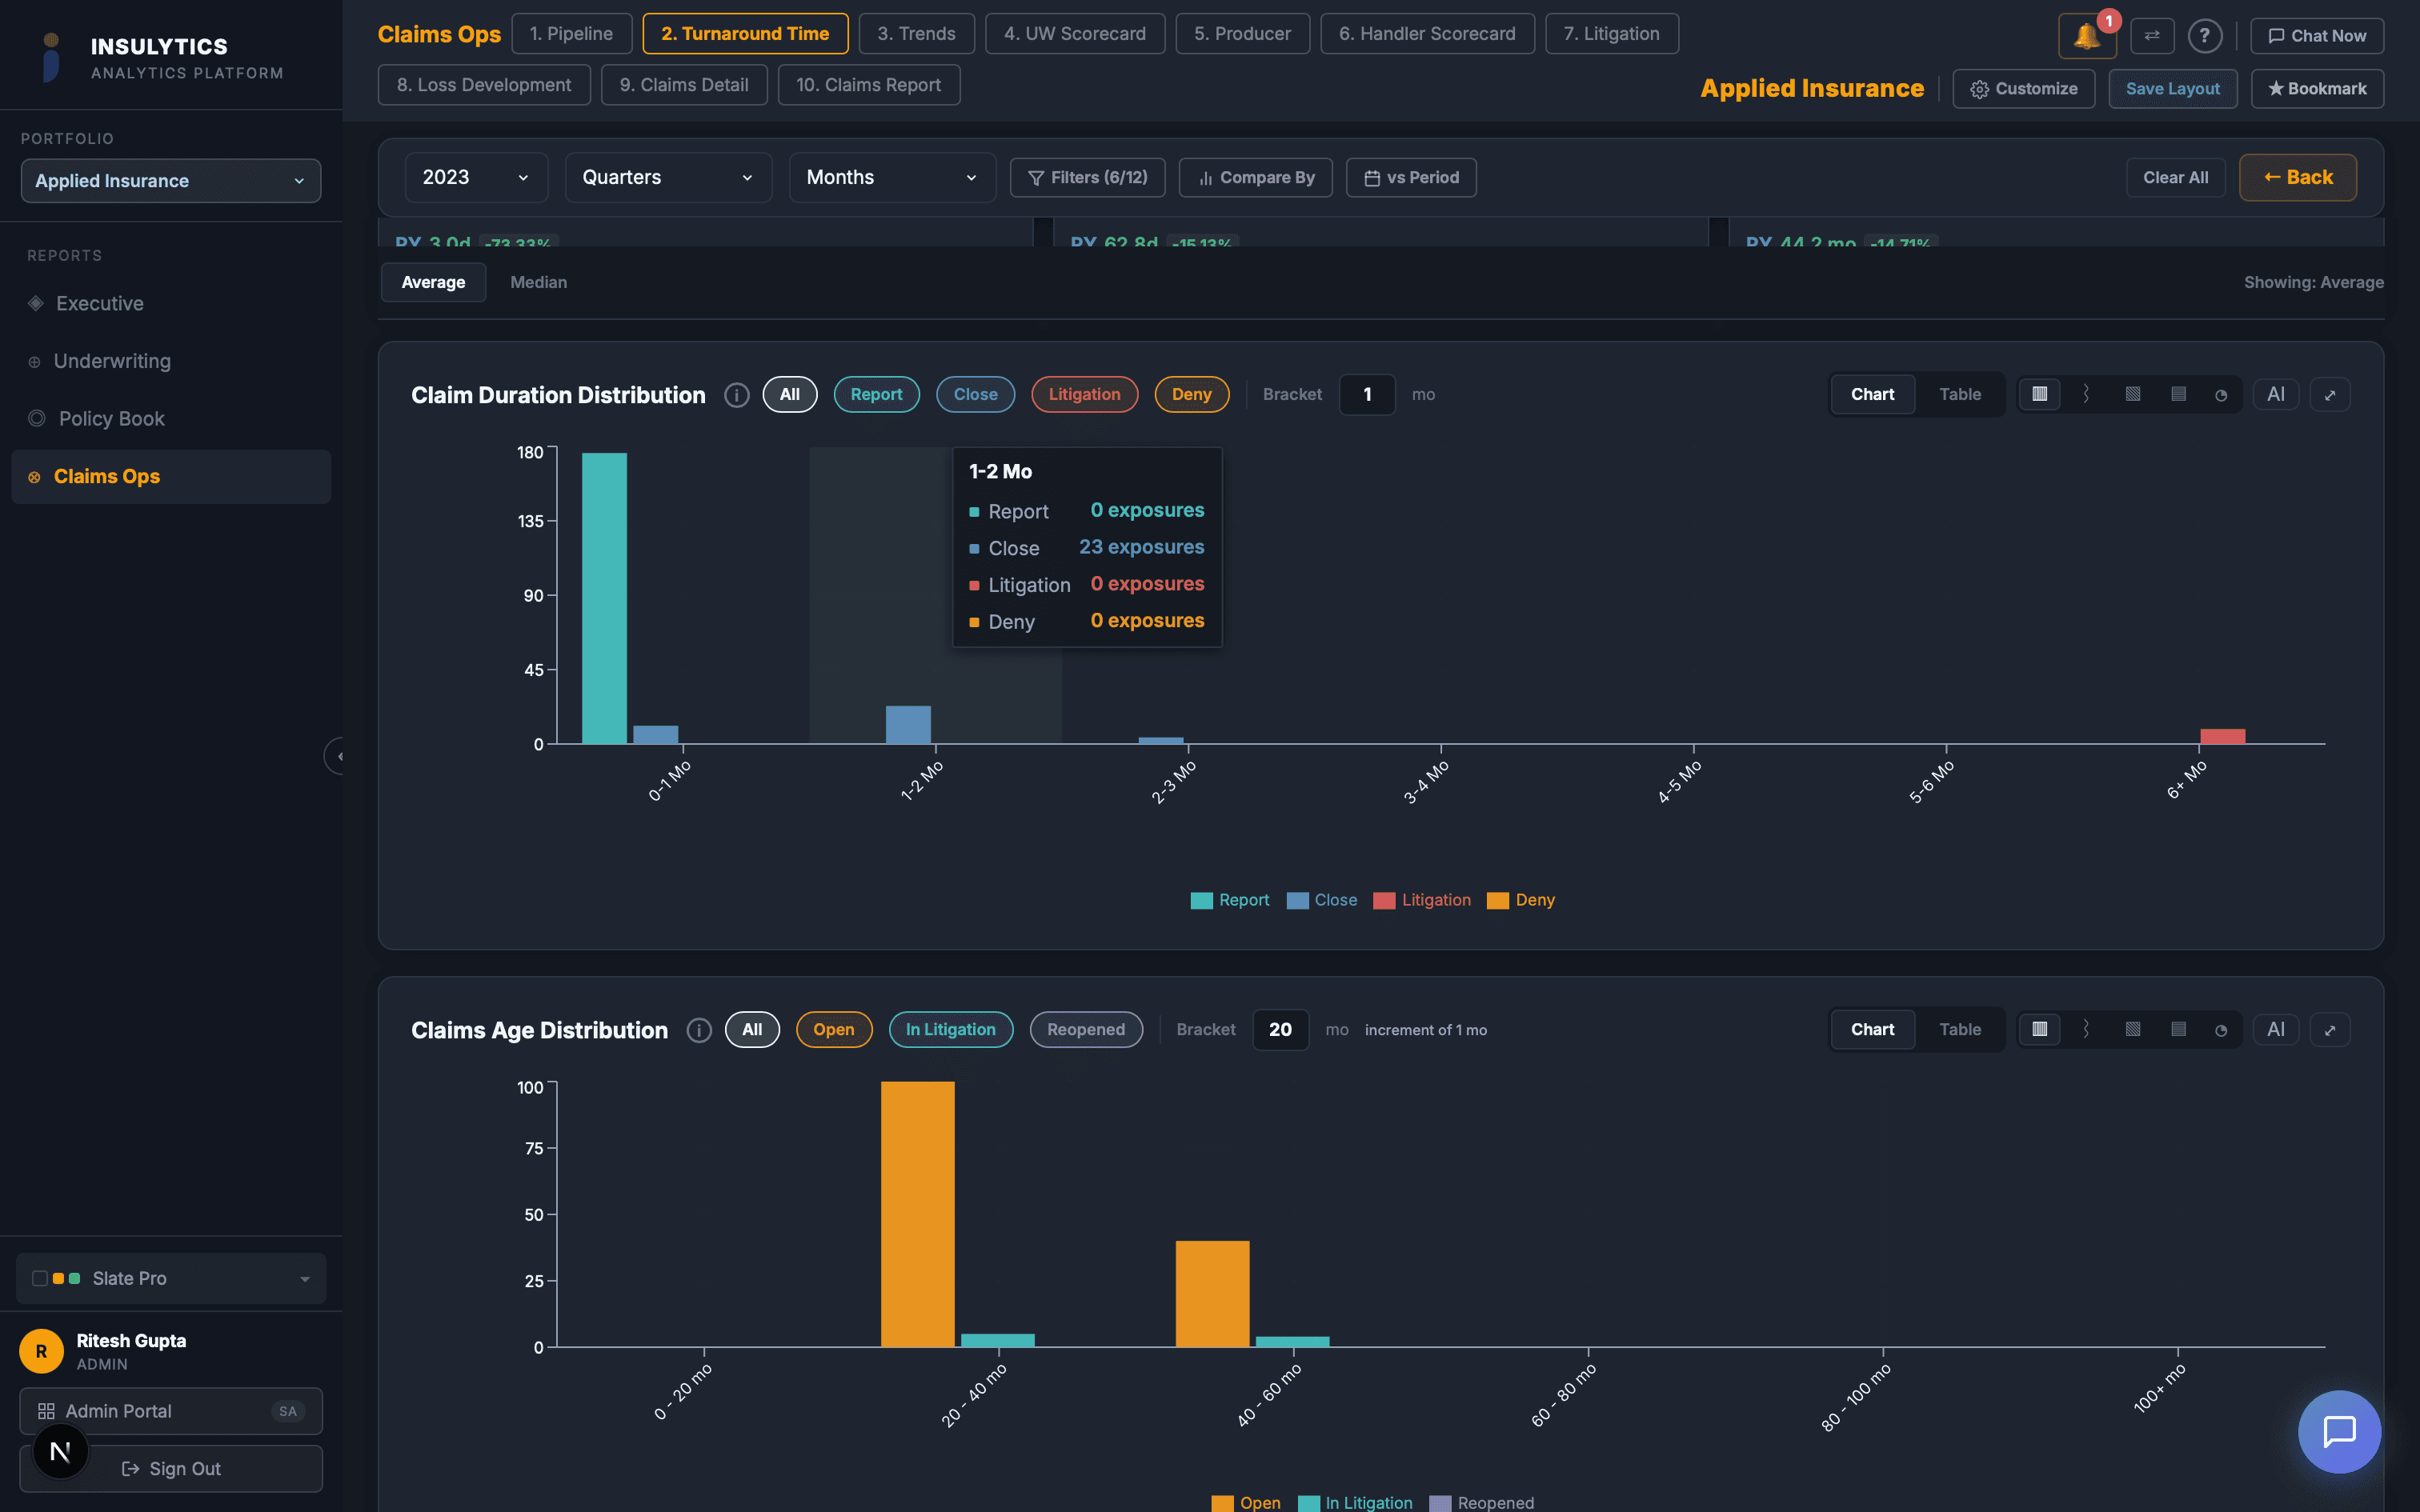
Cycle Time Analysis
Waterfall breakdown of processing time — received to cleared, cleared to quote, quote to bind.
Quote Analytics
Quote rates, revision tracking, and competitive win/loss analysis.
Policy & Portfolio
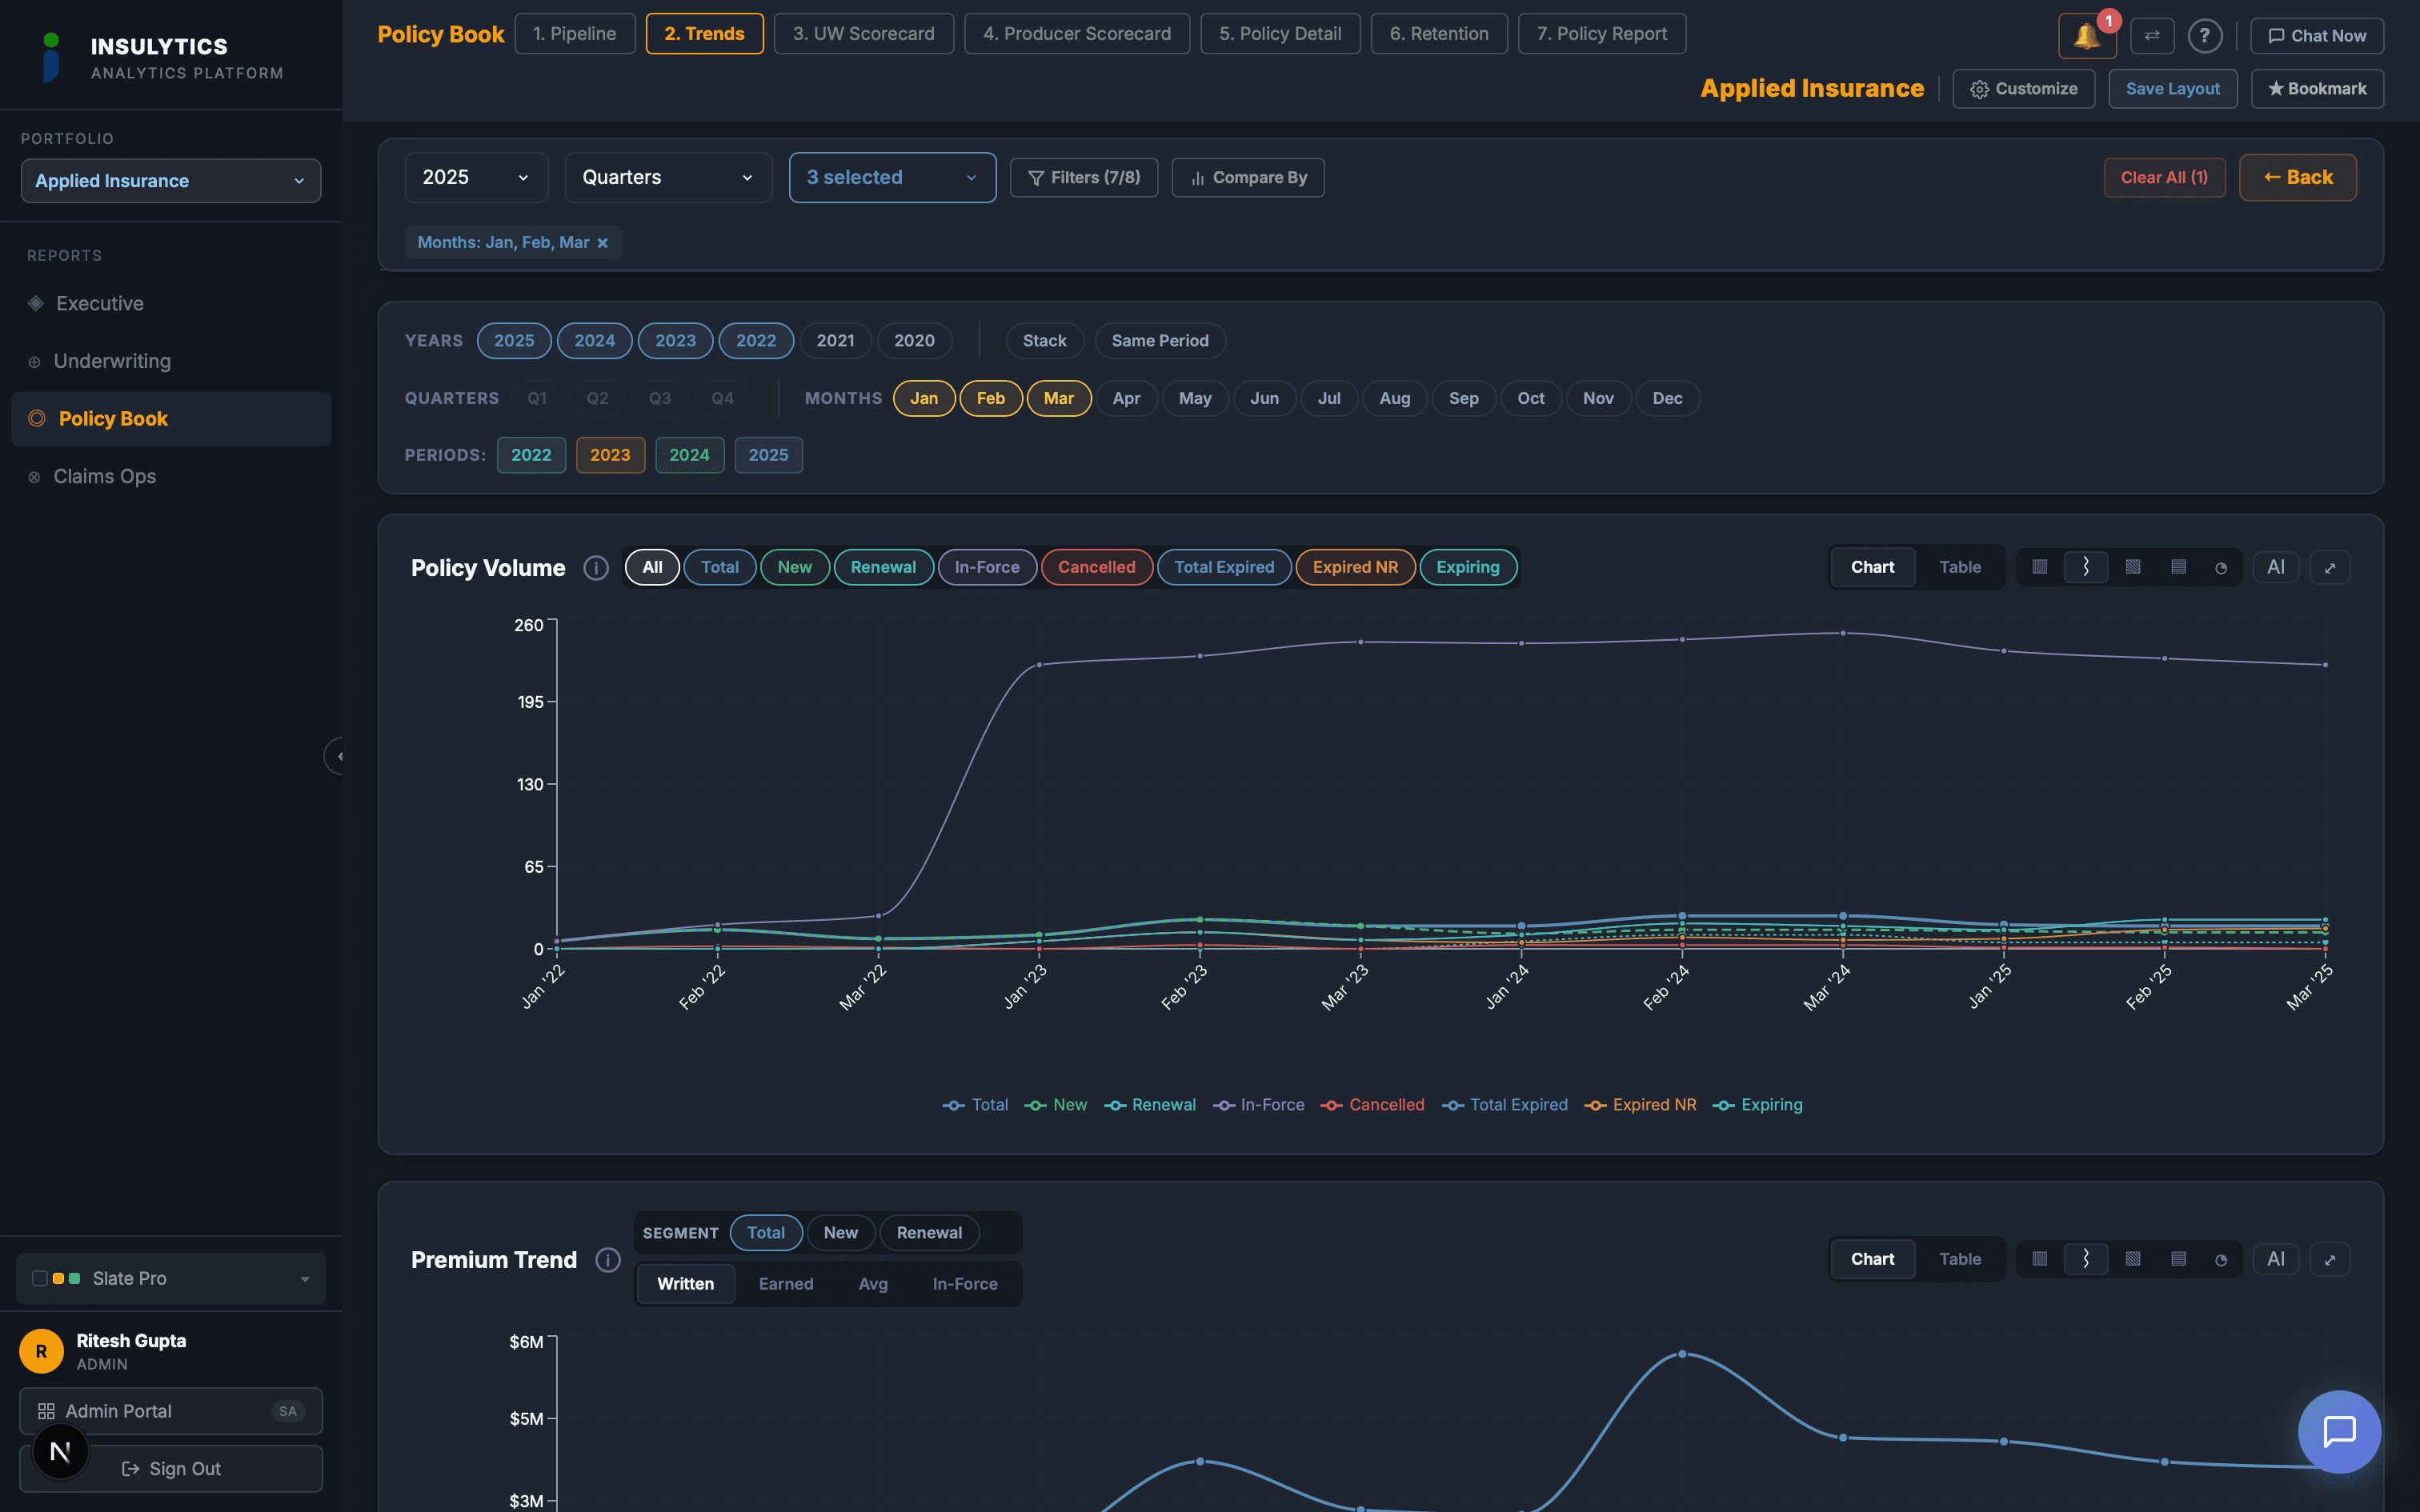
Policy Trends
Multi-year premium trends, retention rates, and book growth analysis with comparison.
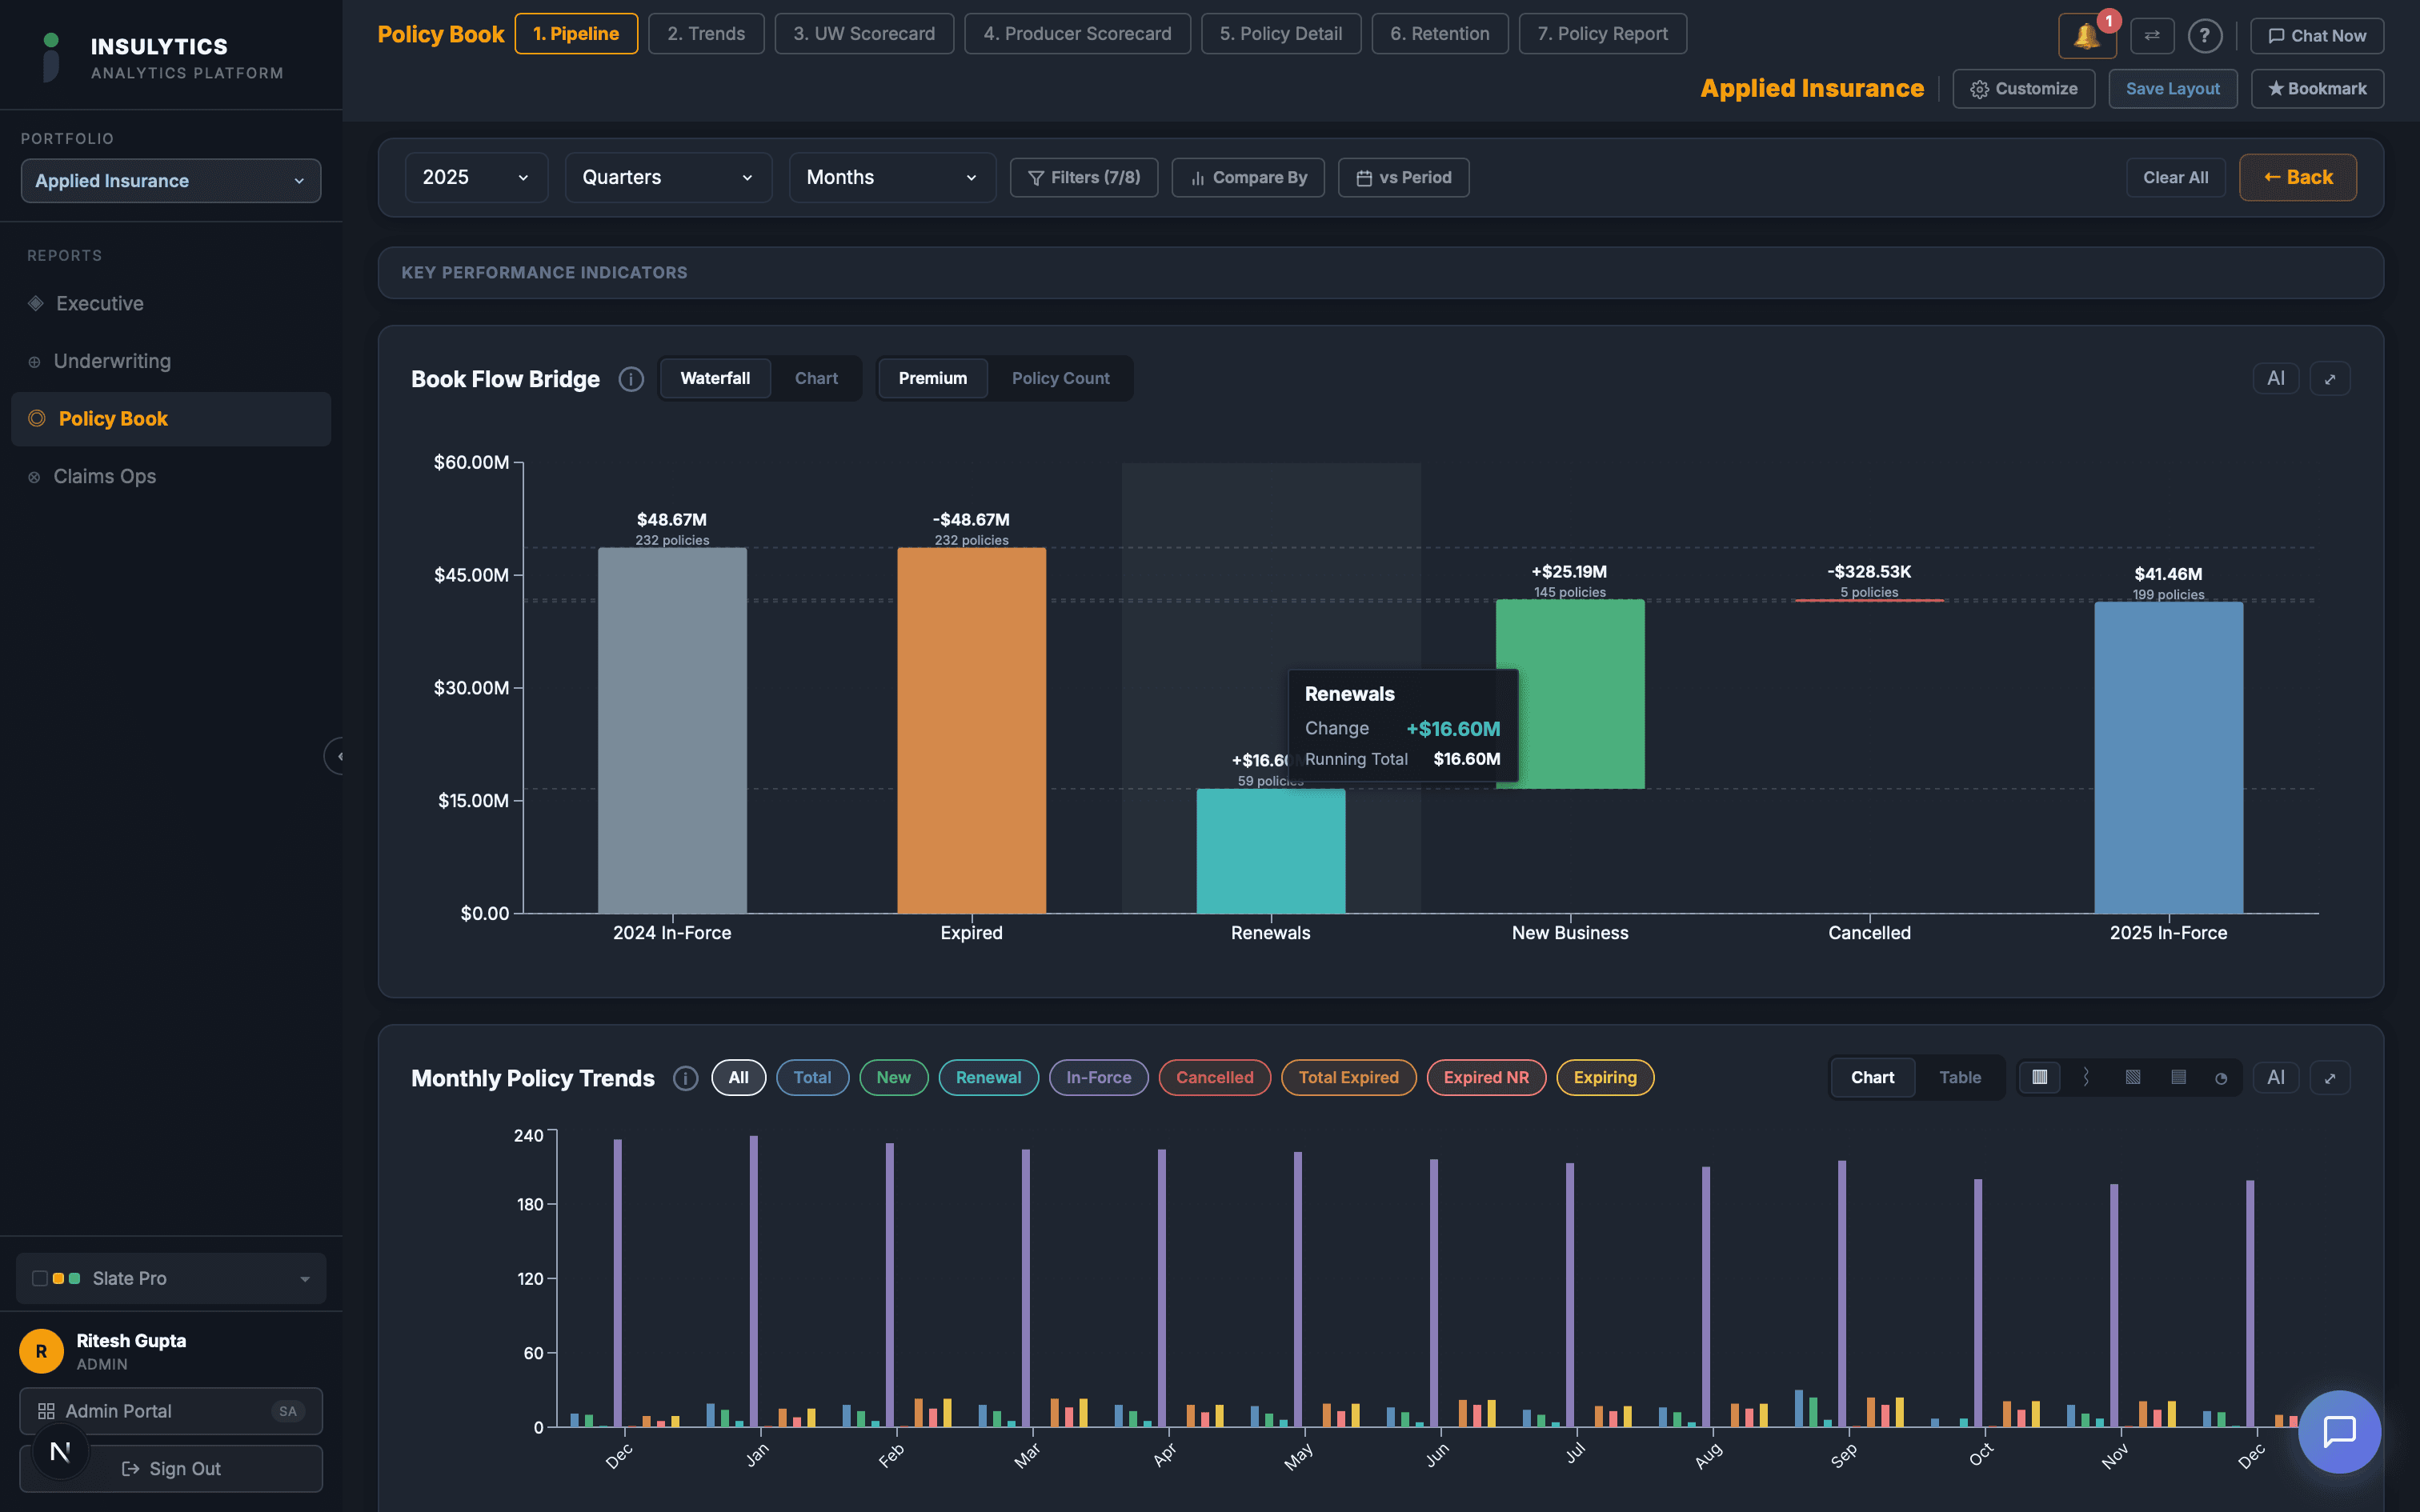
Policy Pipeline
In-force, new, renewal, cancelled, and expired premium flow visualization.
Claims & Loss
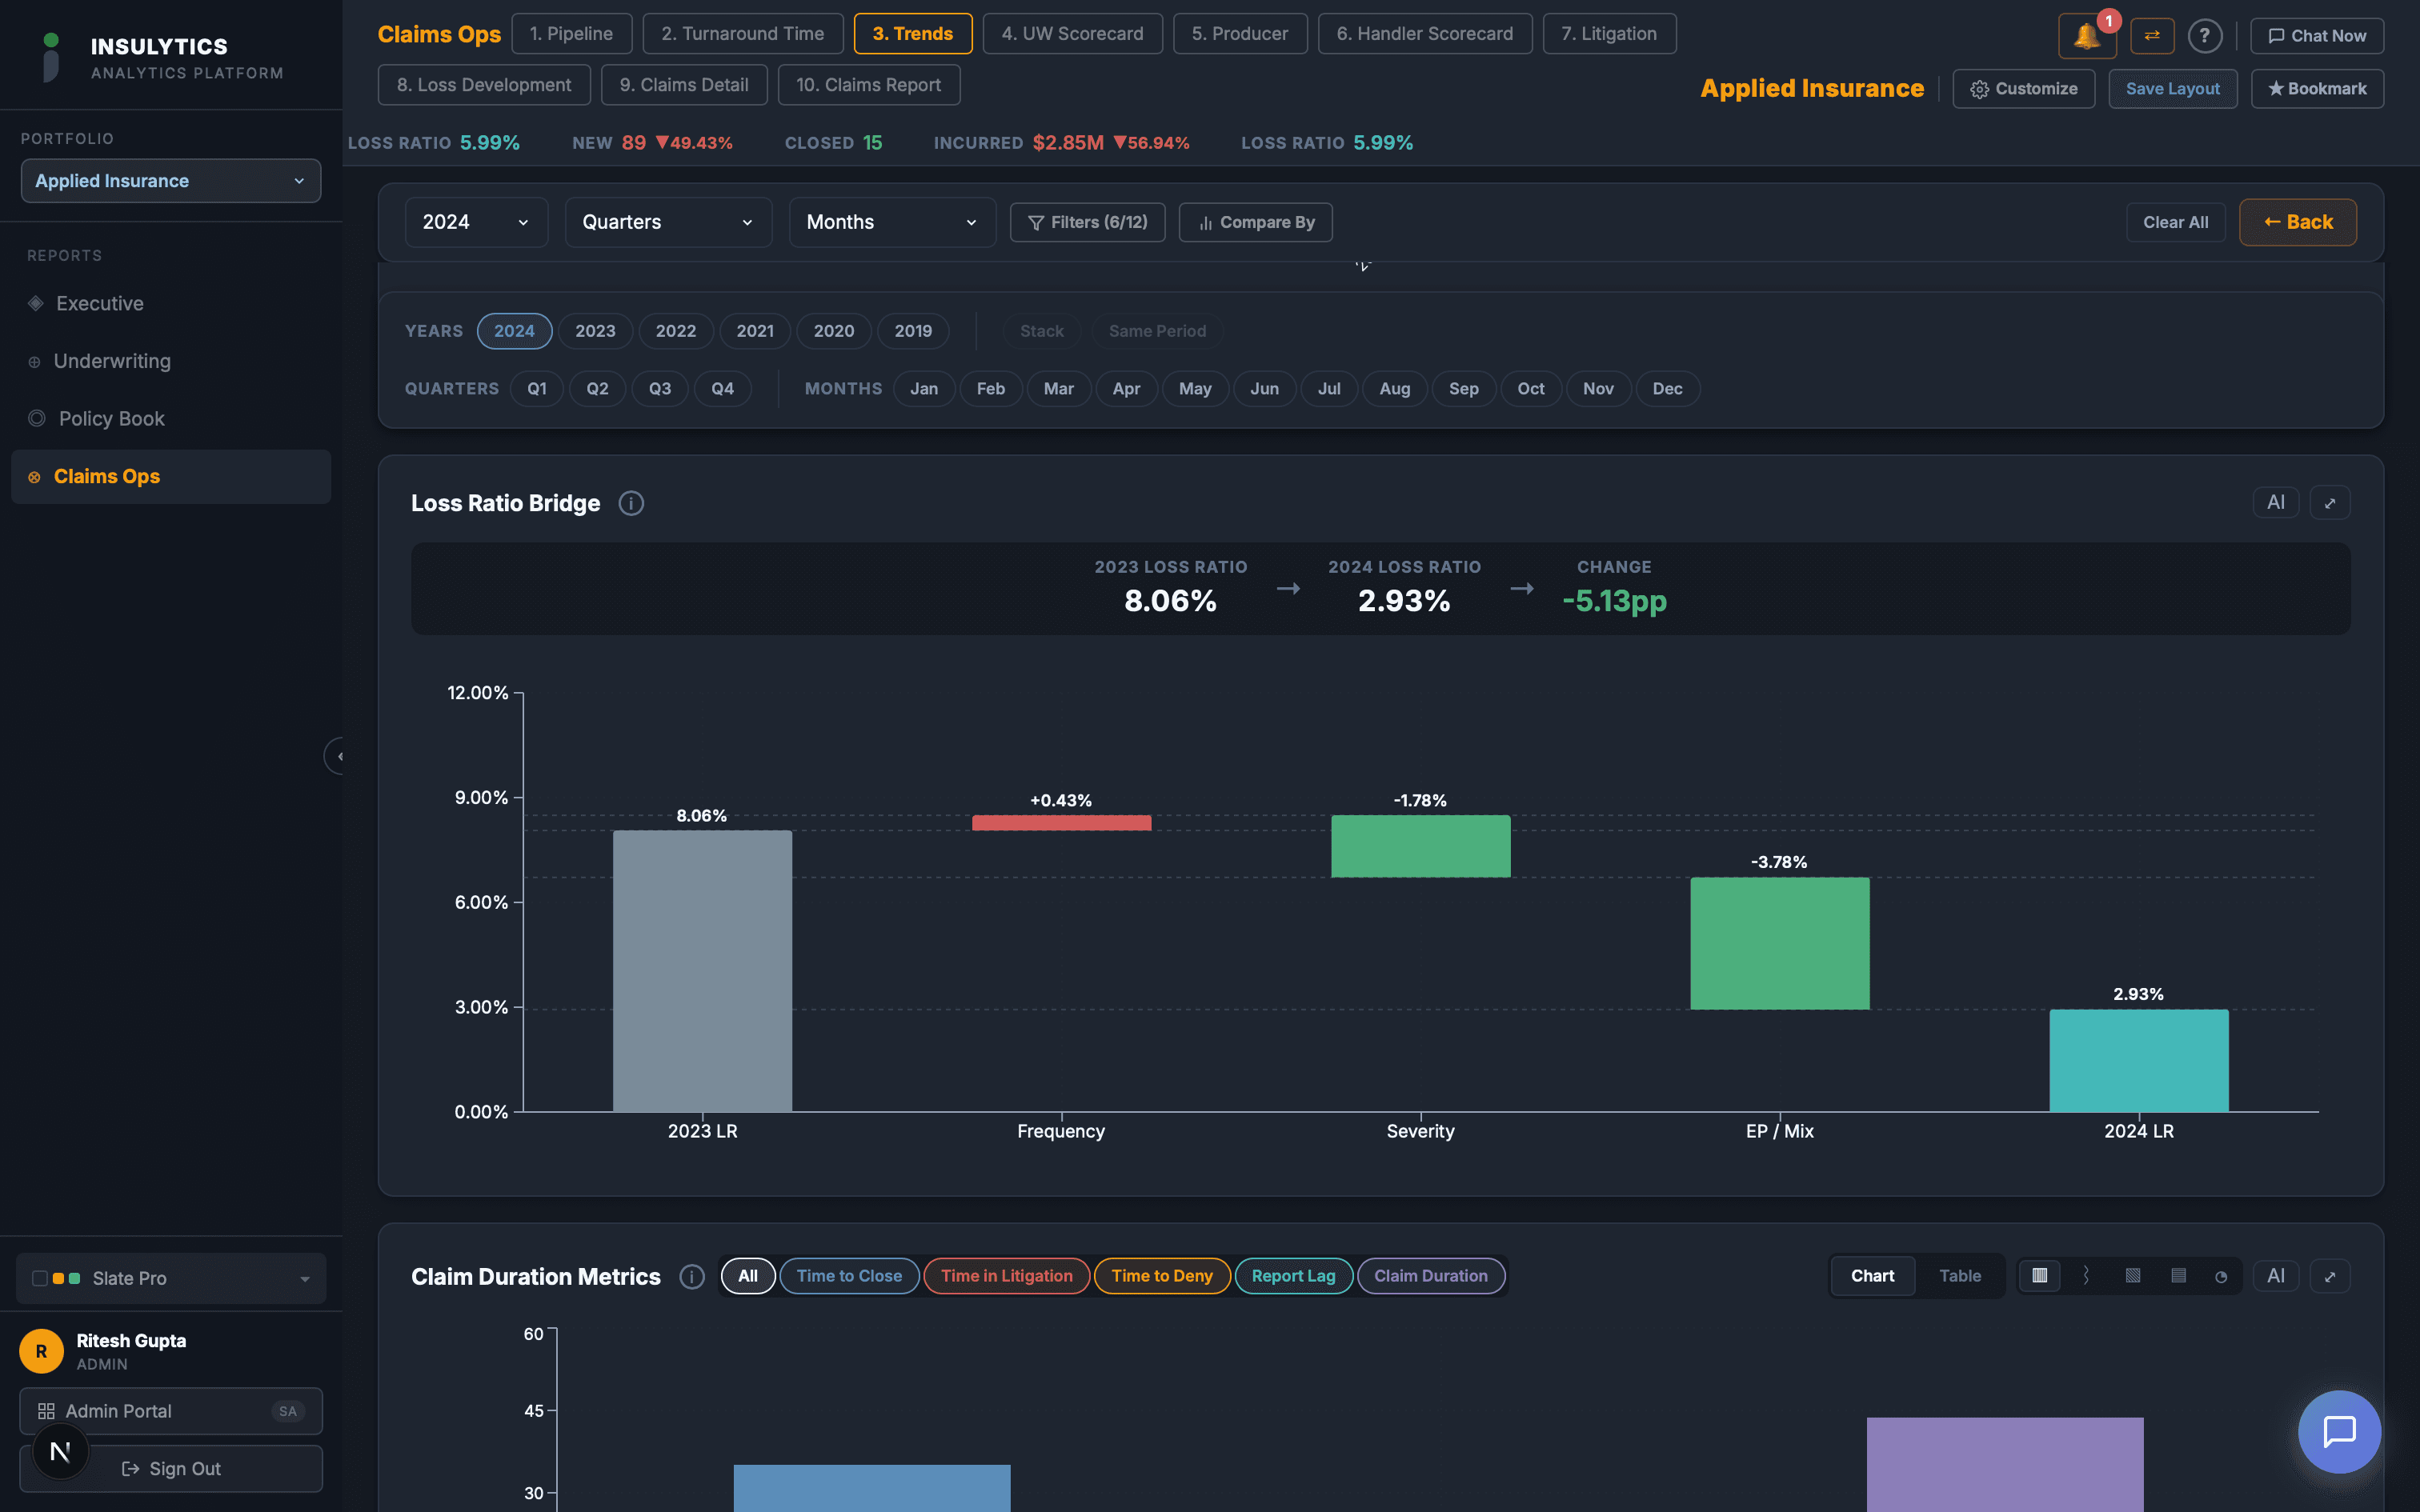
Claims Trends
Severity, frequency, loss ratio trends across accident year and calendar year.
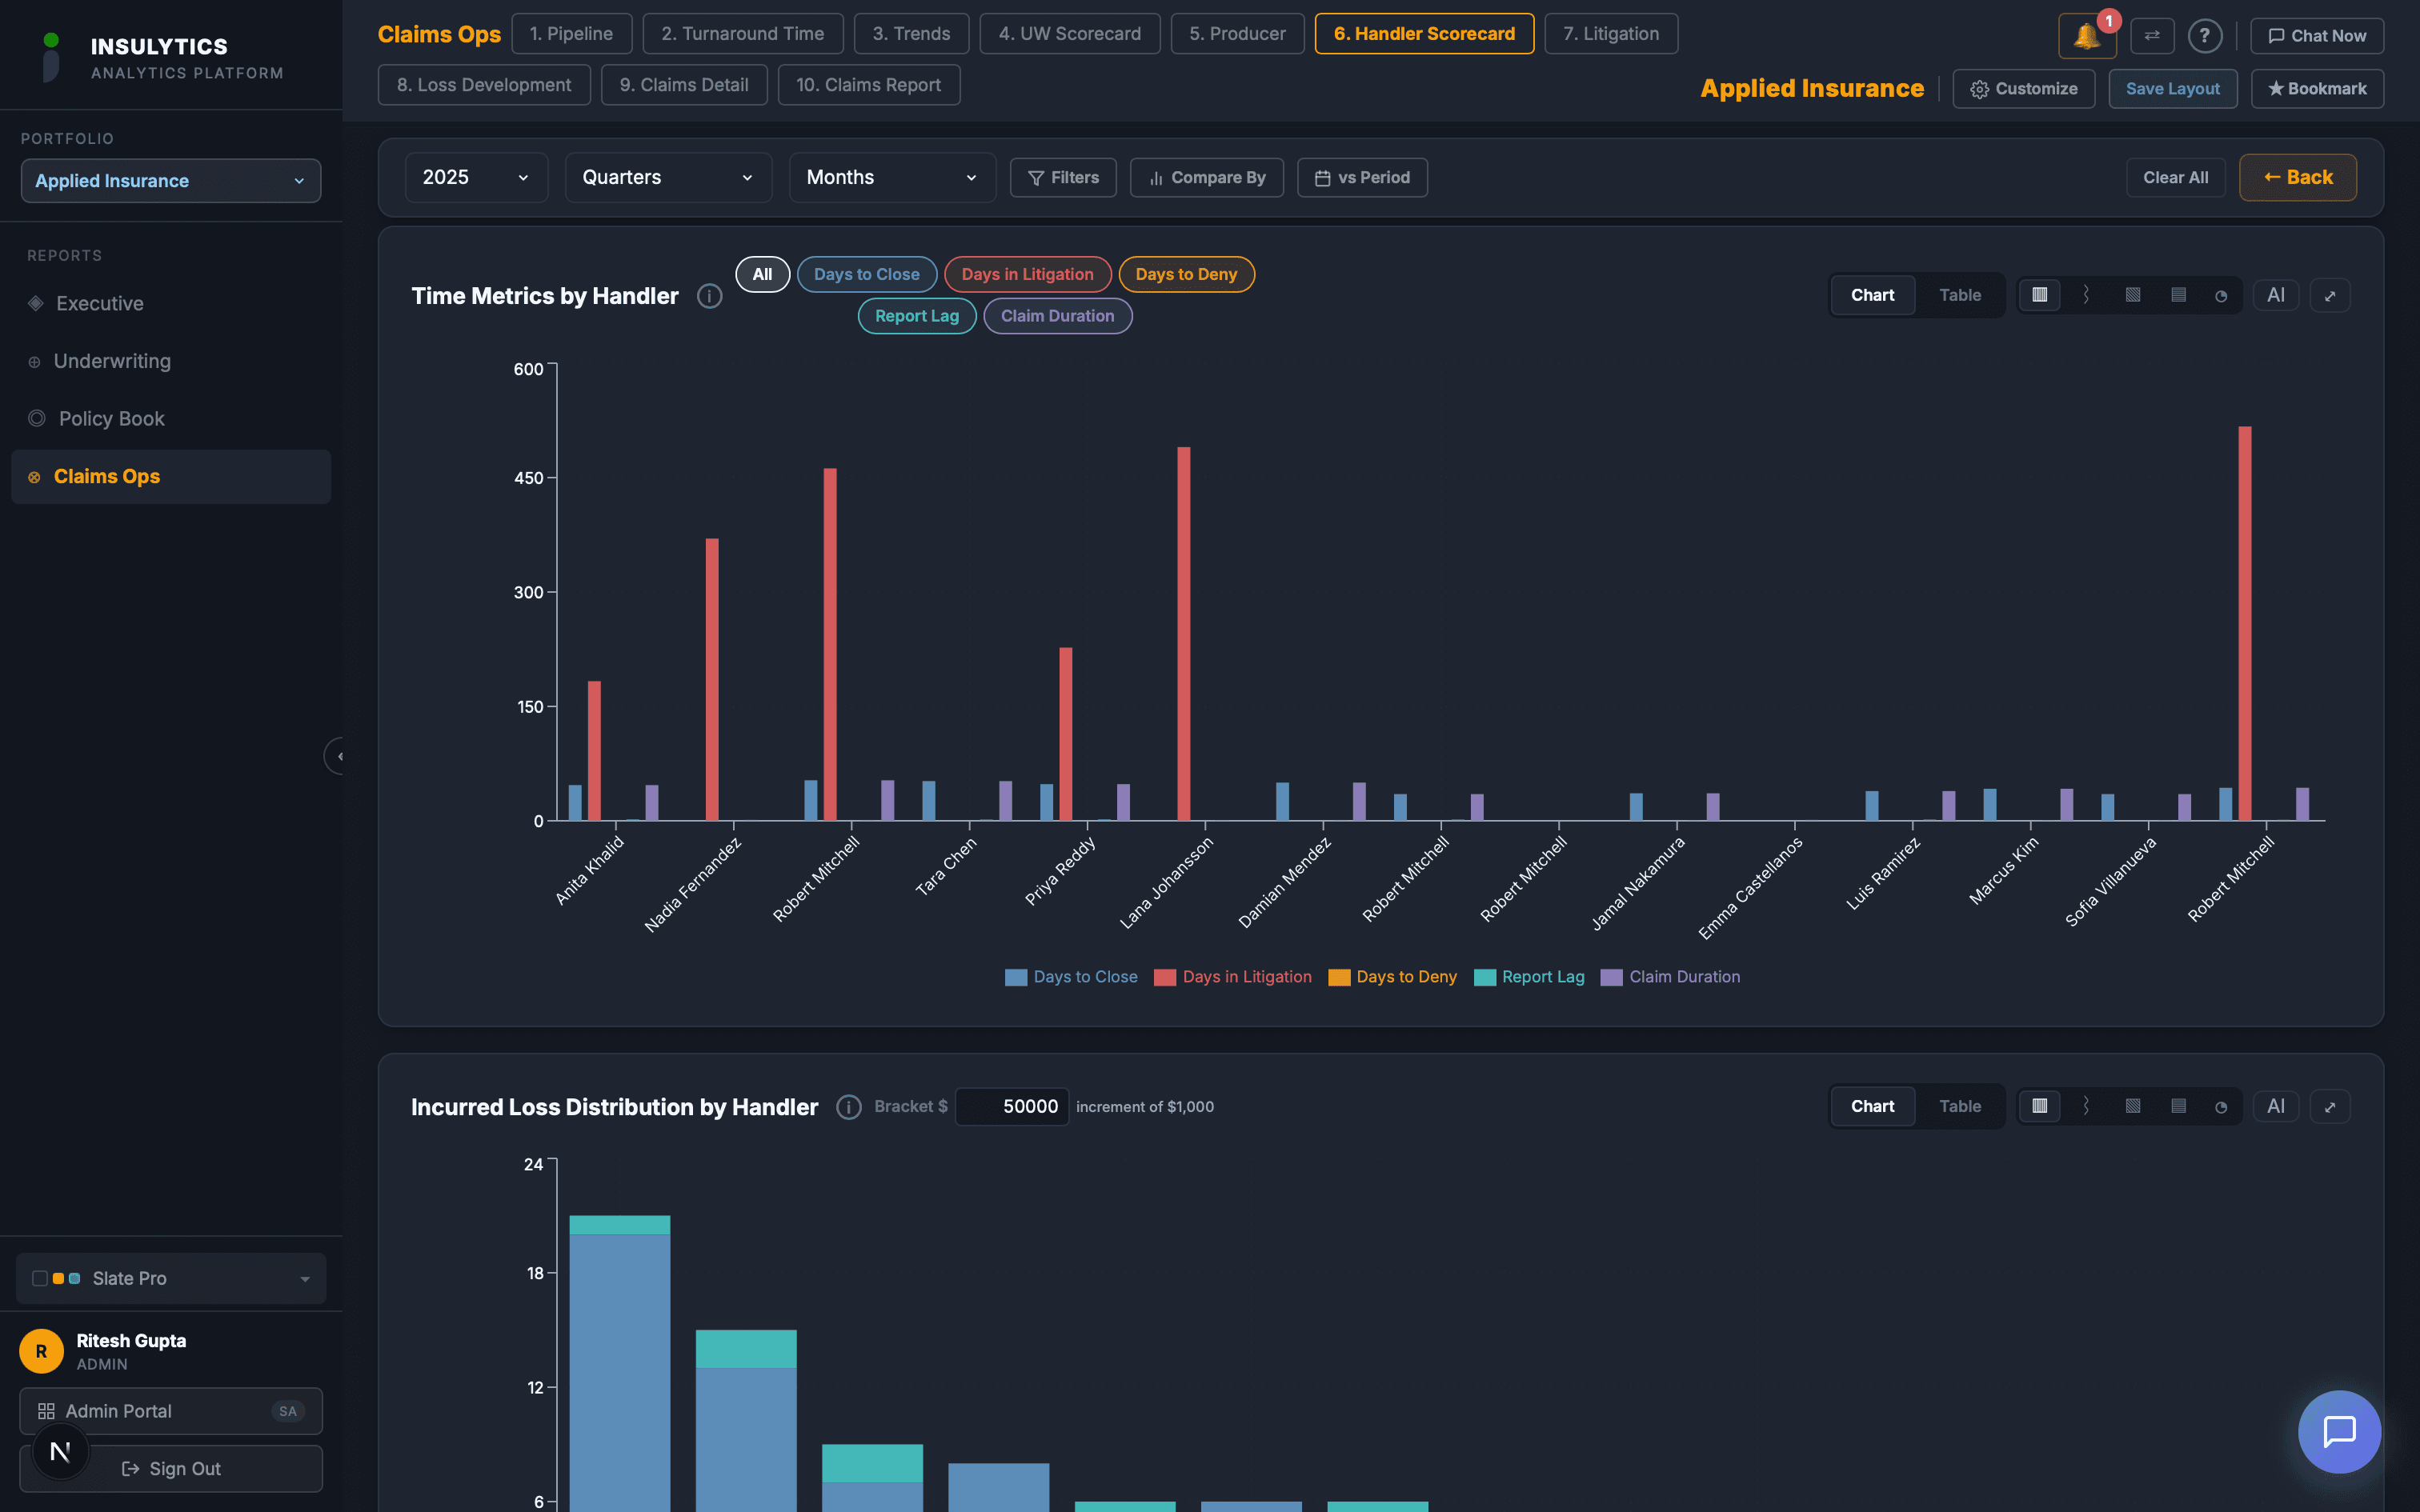
Handler Scorecard
Individual claims handler performance with caseload, open claims, and efficiency.
Producer & Agent
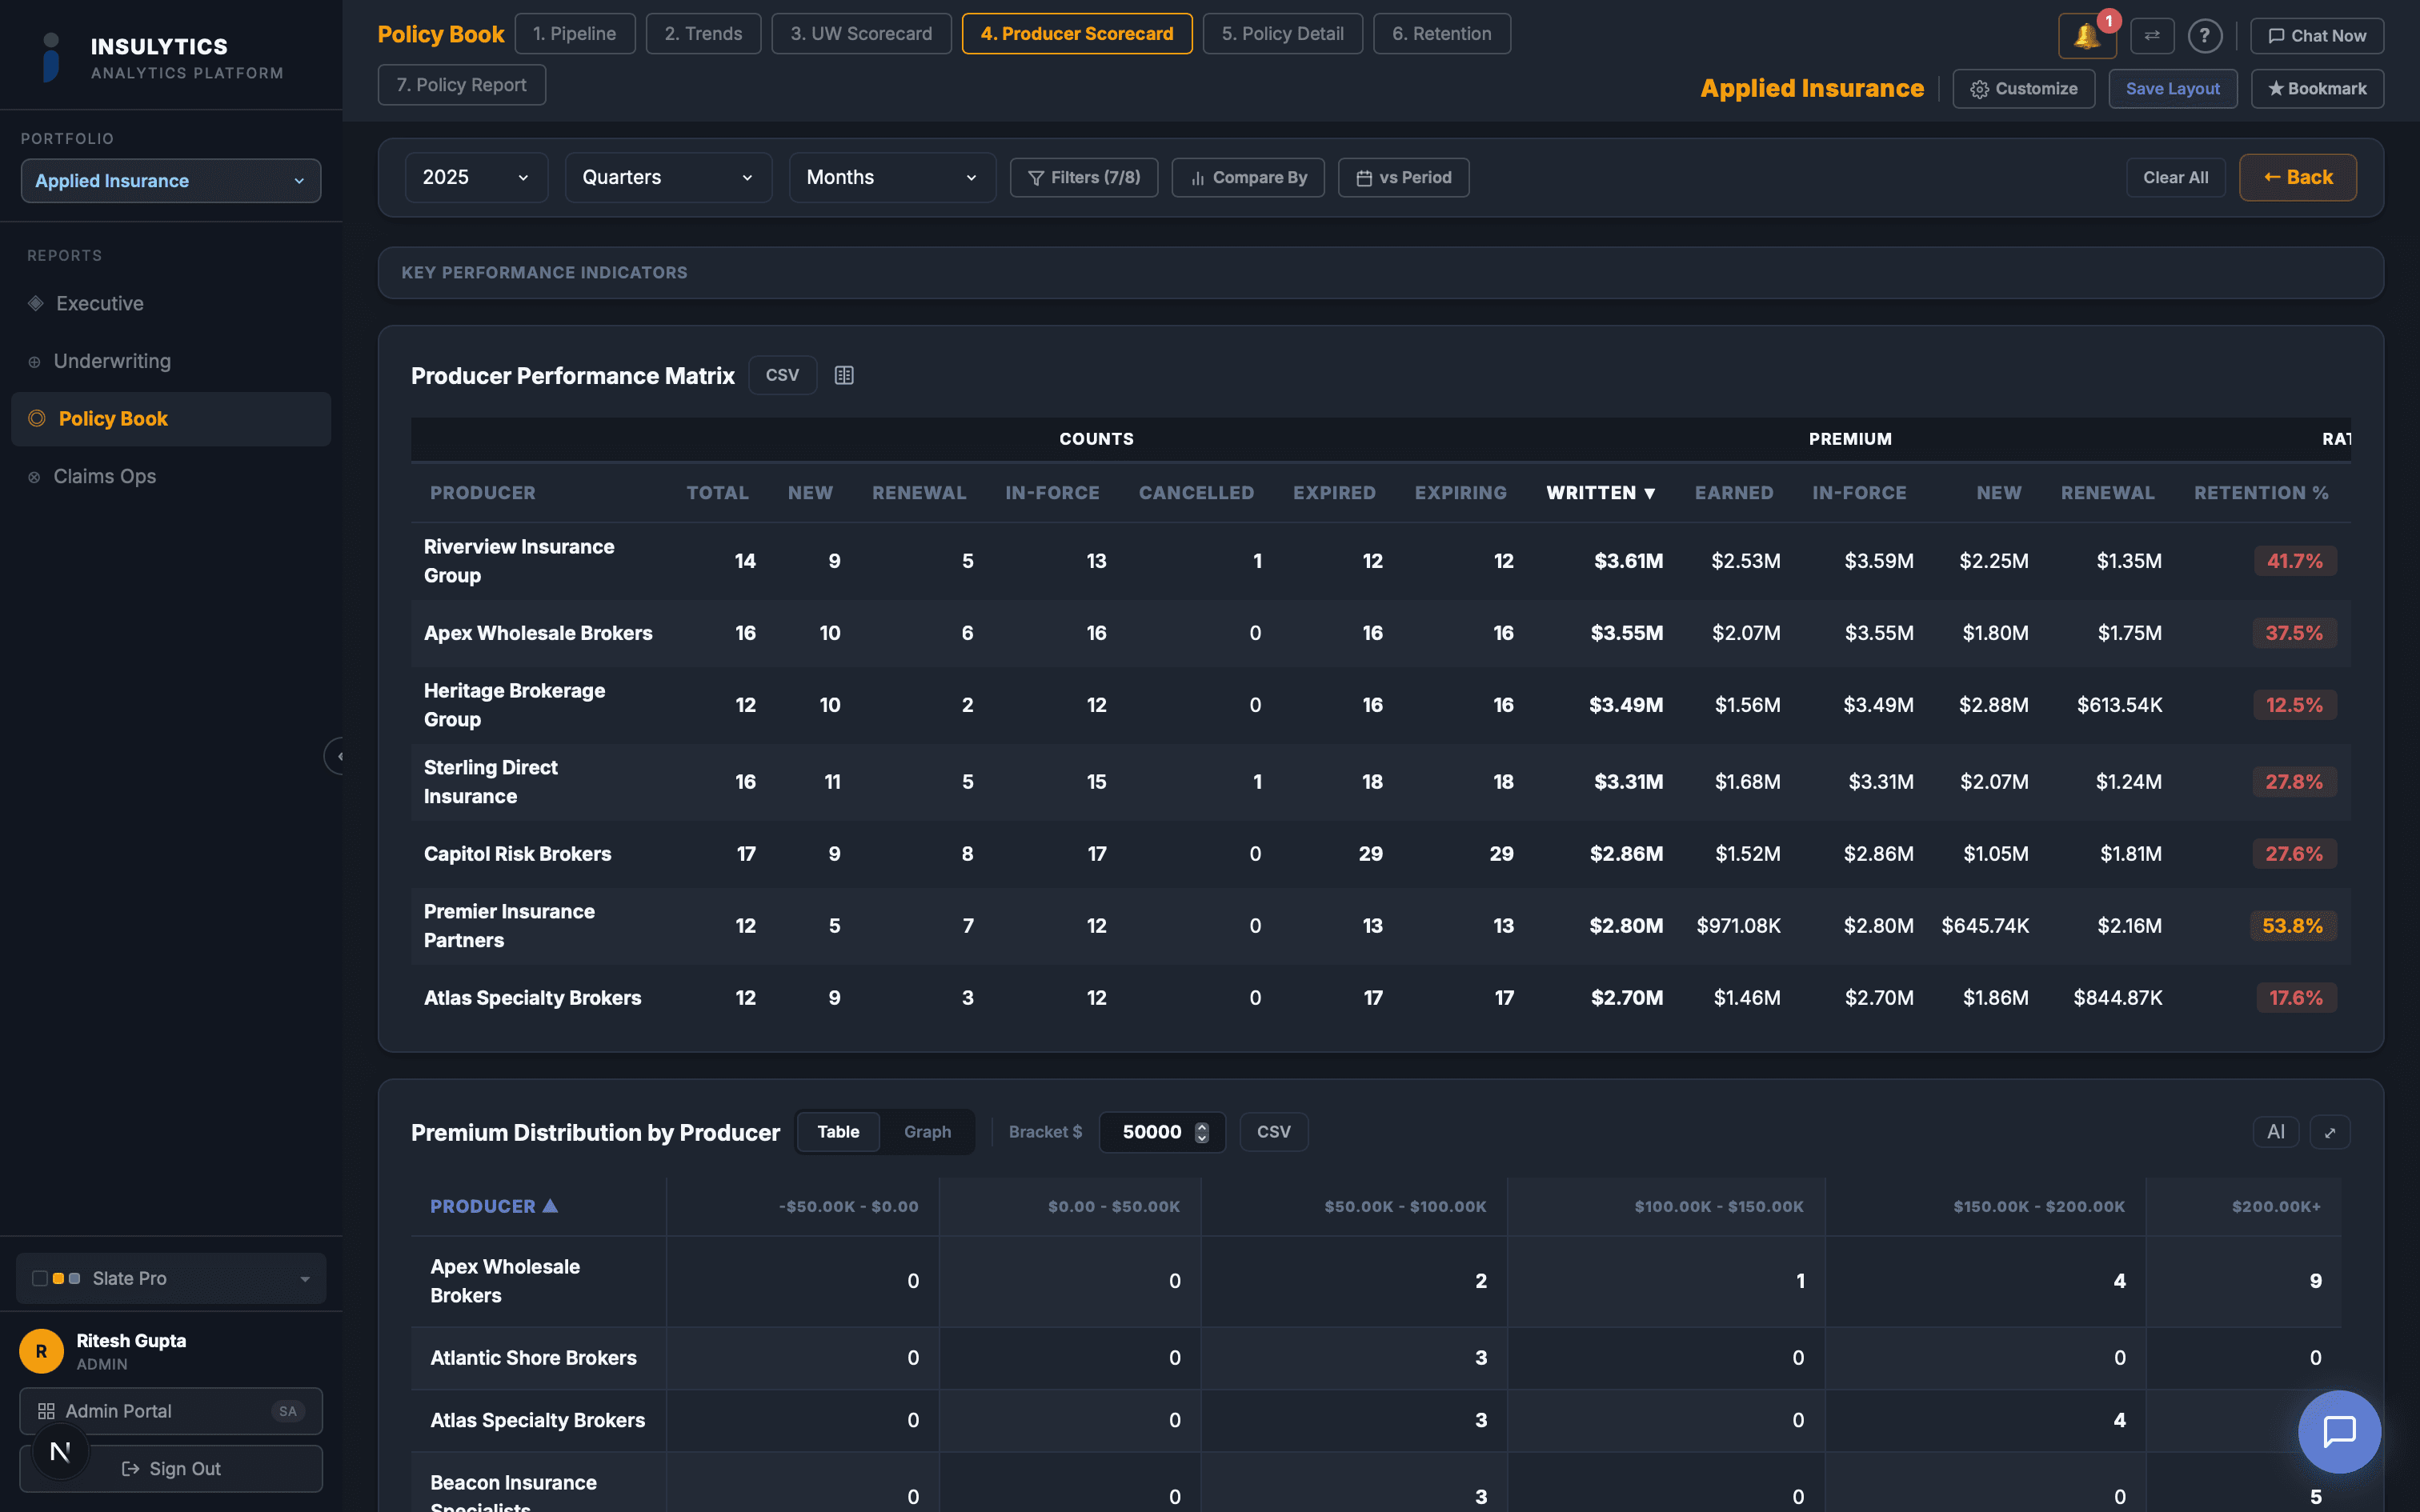
Producer Scorecard
Combined policy + claims metrics per producer with multi-metric toggle charts.
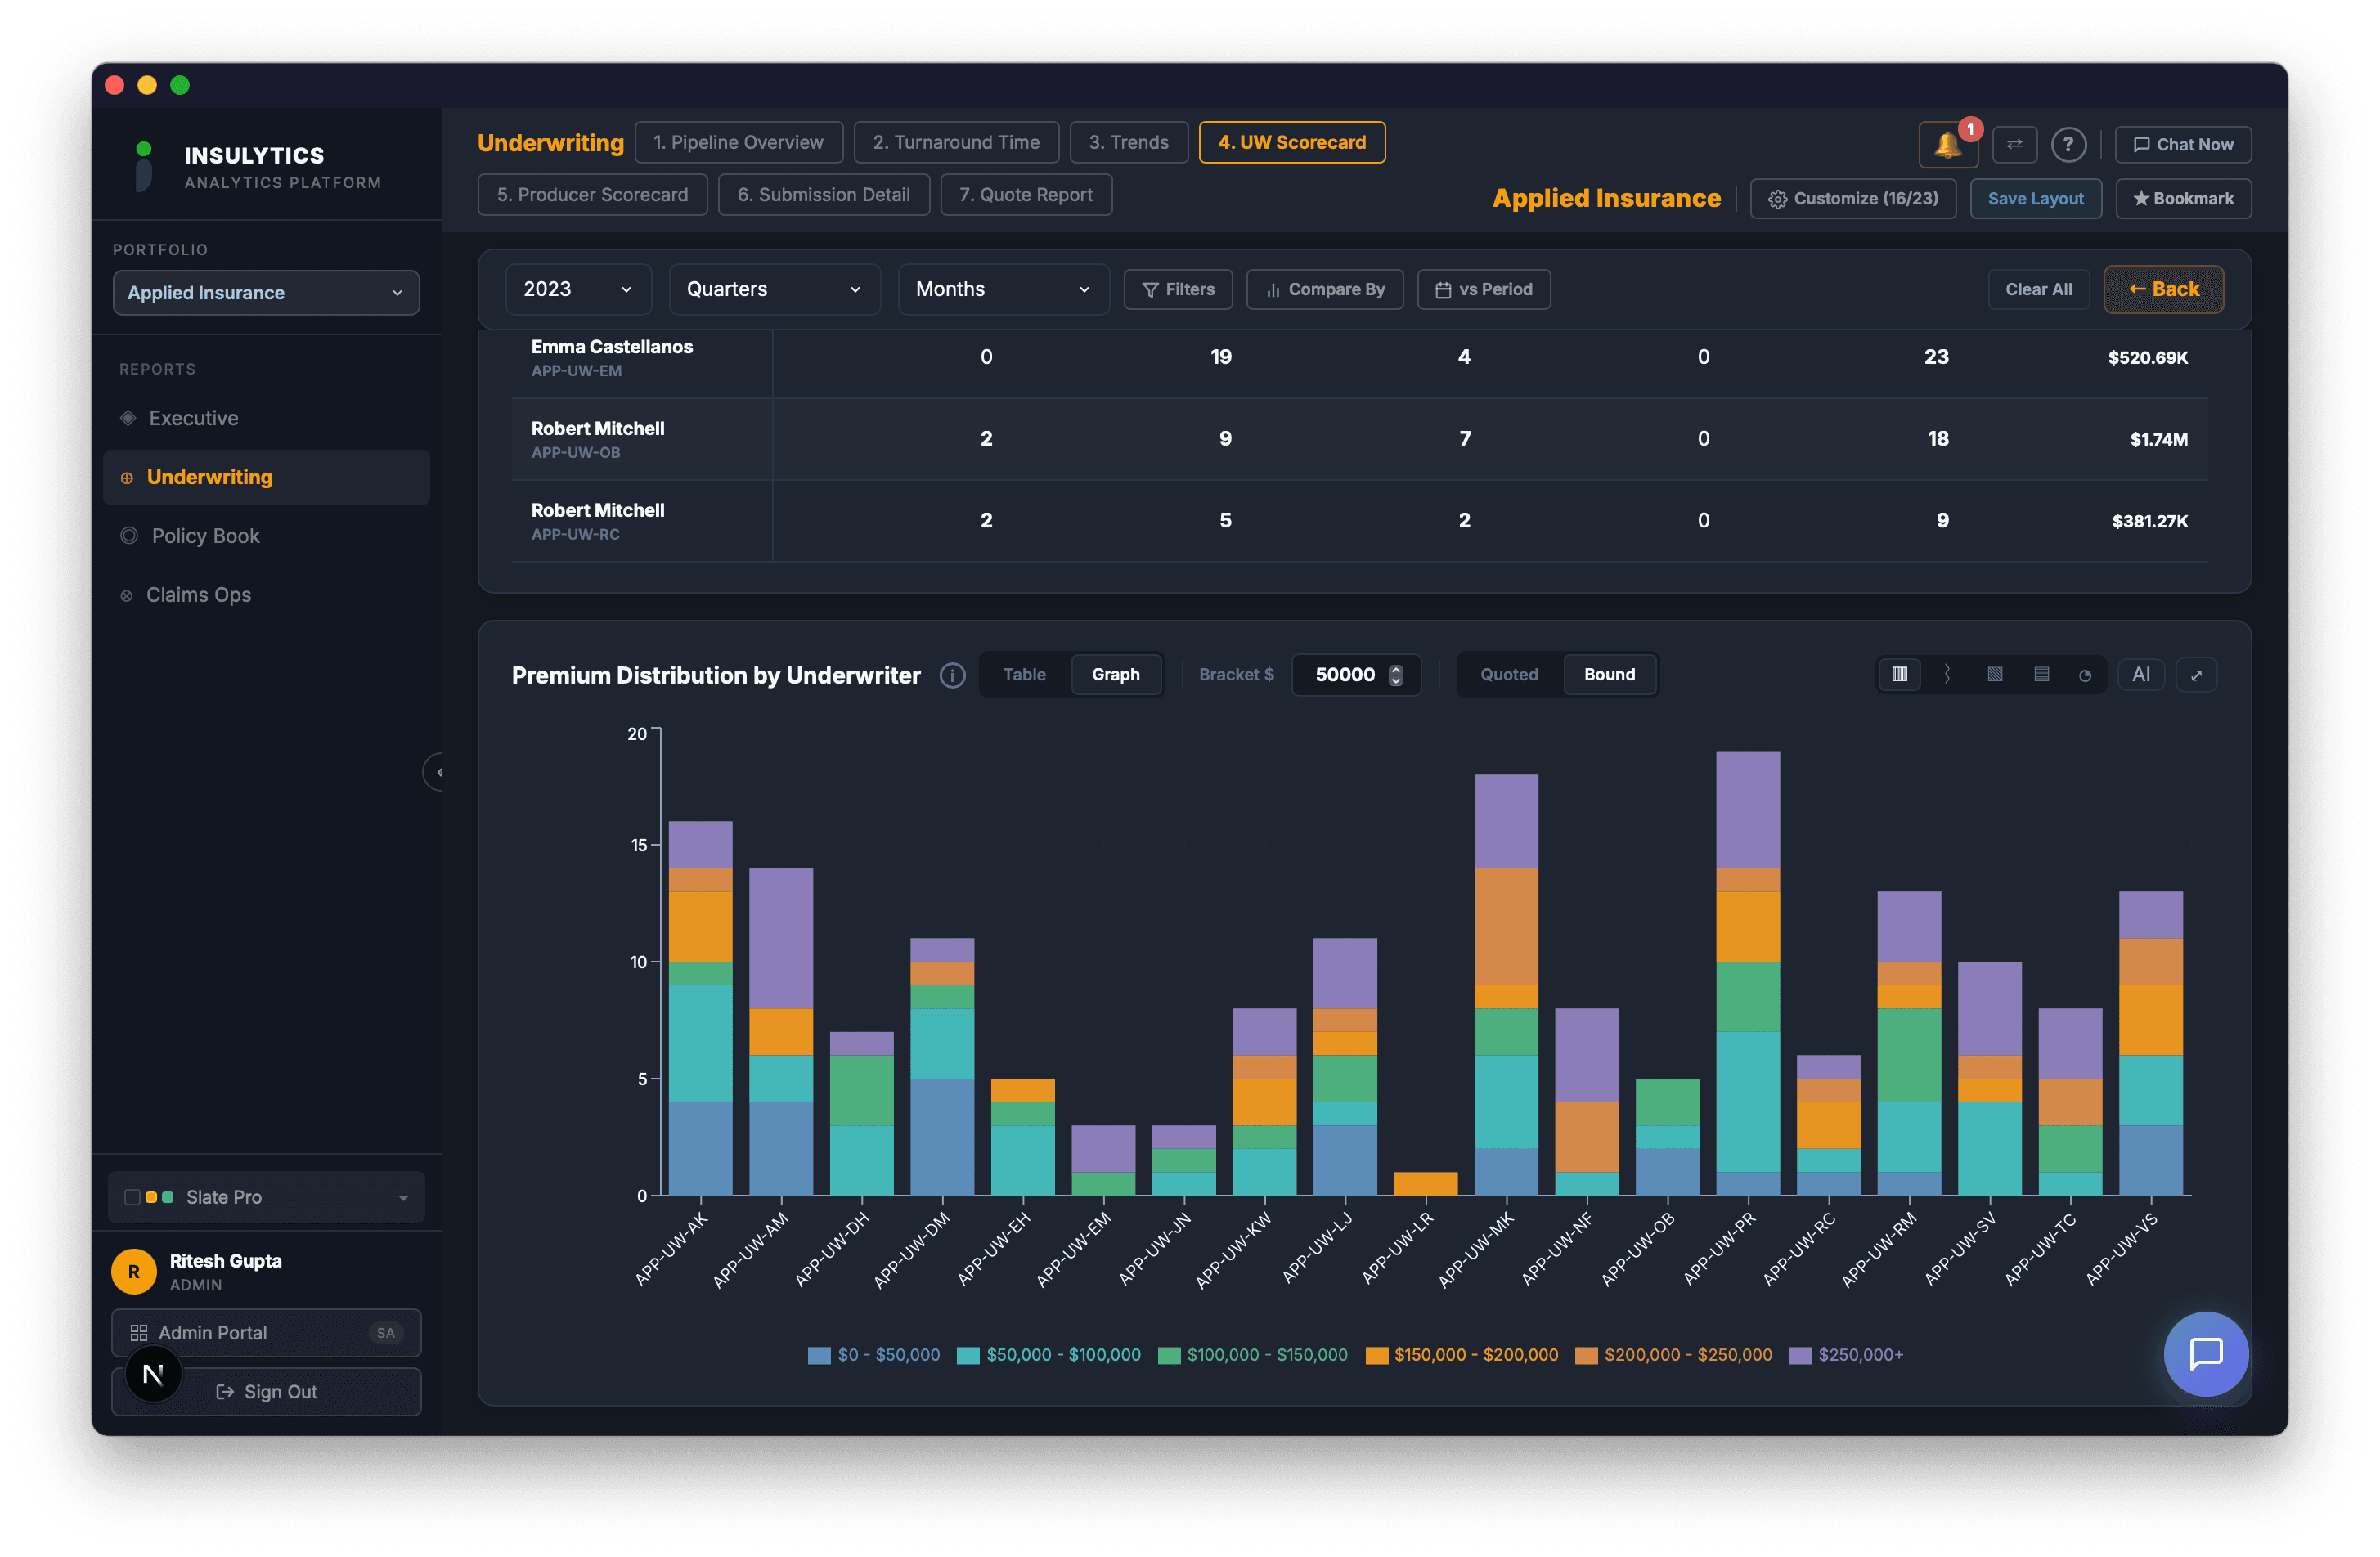
UW Scorecard
Underwriter performance across submissions, policies, and claims with drill-down.
AI That Understands Insurance
Every user gets an AI analyst that speaks insurance. Ask questions, generate charts, set alerts, and build reports — all in plain English.
Ask Questions, Get Charts
Type a question in plain English and Insulytics AI generates the answer — as a table, chart, or summary. No SQL, no training, no waiting for the analytics team.
- Natural language to SQL to chart — fully automated
- Bar, line, area, pie — AI picks the best visualization
- Available on every dashboard page for every user
- Token usage tracking and cost transparency
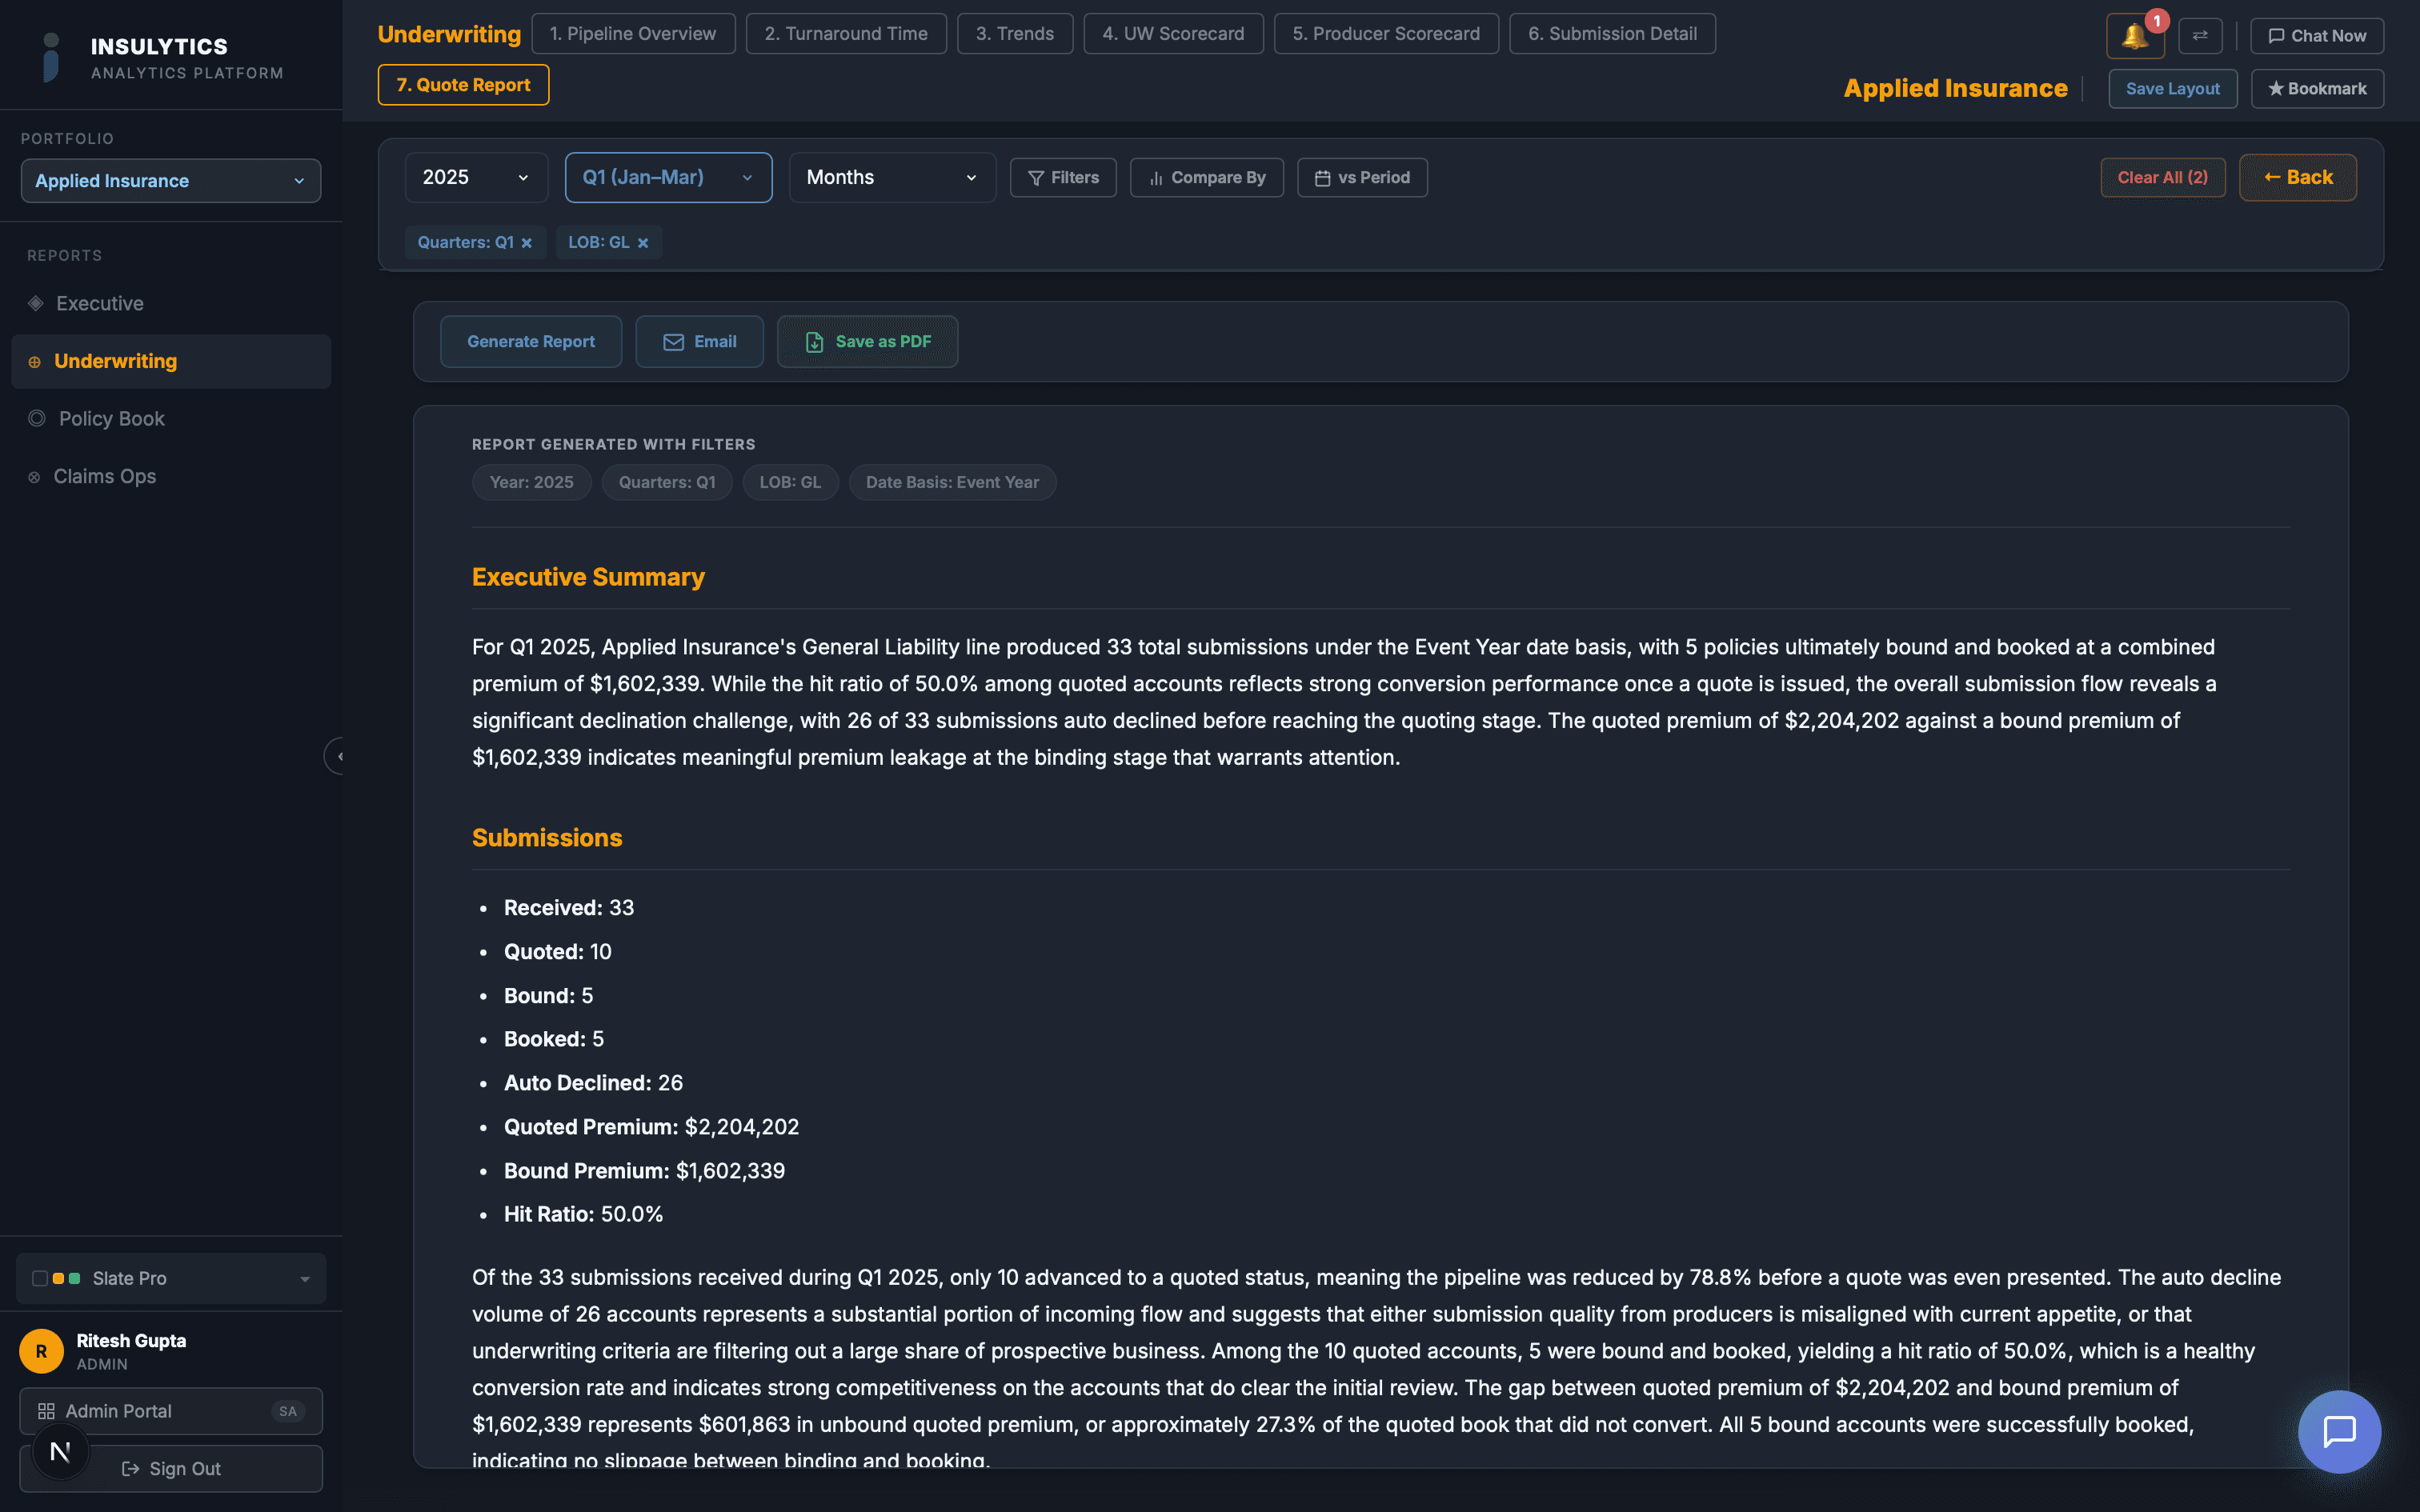
AI-Generated Reports
Generate comprehensive reports on the fly for any filter criteria. Pick your dimensions, time period, and metrics — AI assembles the narrative and data tables instantly.
- On-demand reports for any LOB, producer, or underwriter
- Filter by date range, business unit, state, or coverage
- Exportable summaries with supporting data
- No report builder — just describe what you need
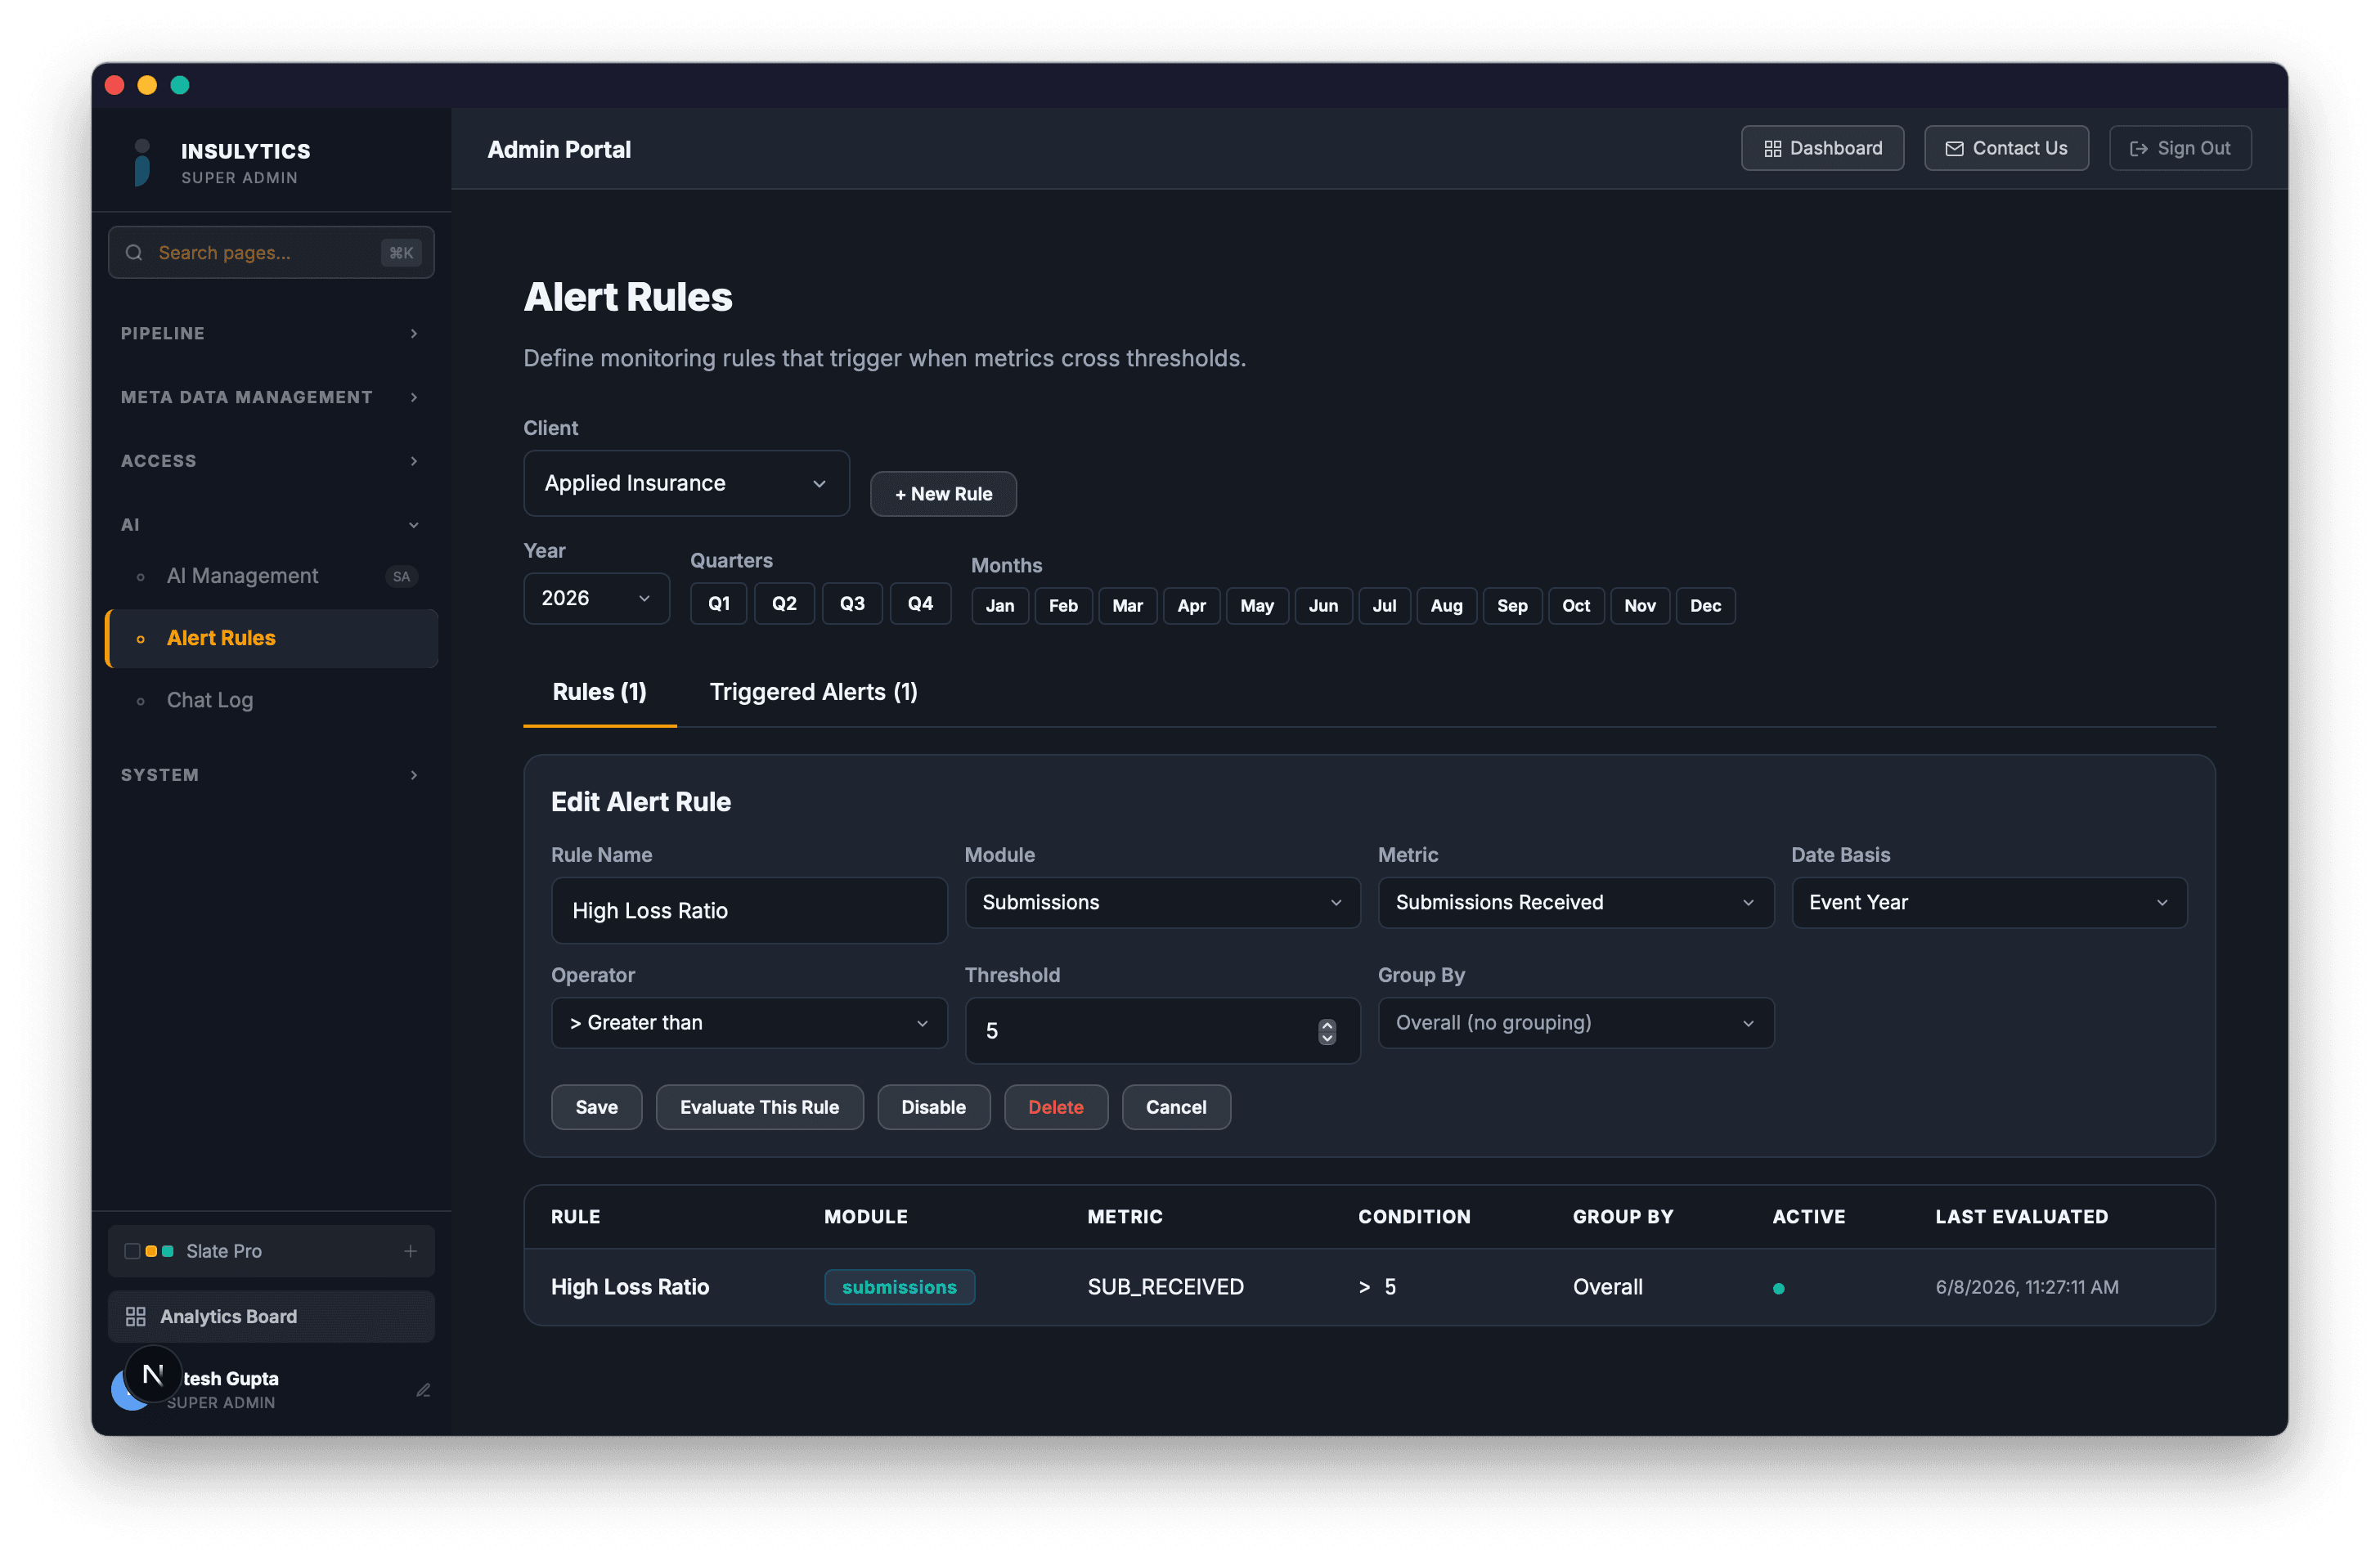
KPI Threshold Alerts
Set rules to monitor any KPI by dimension — get notified when loss ratios spike, hit ratios drop, or cycle times exceed targets. Configure by LOB, producer, underwriter, or state.
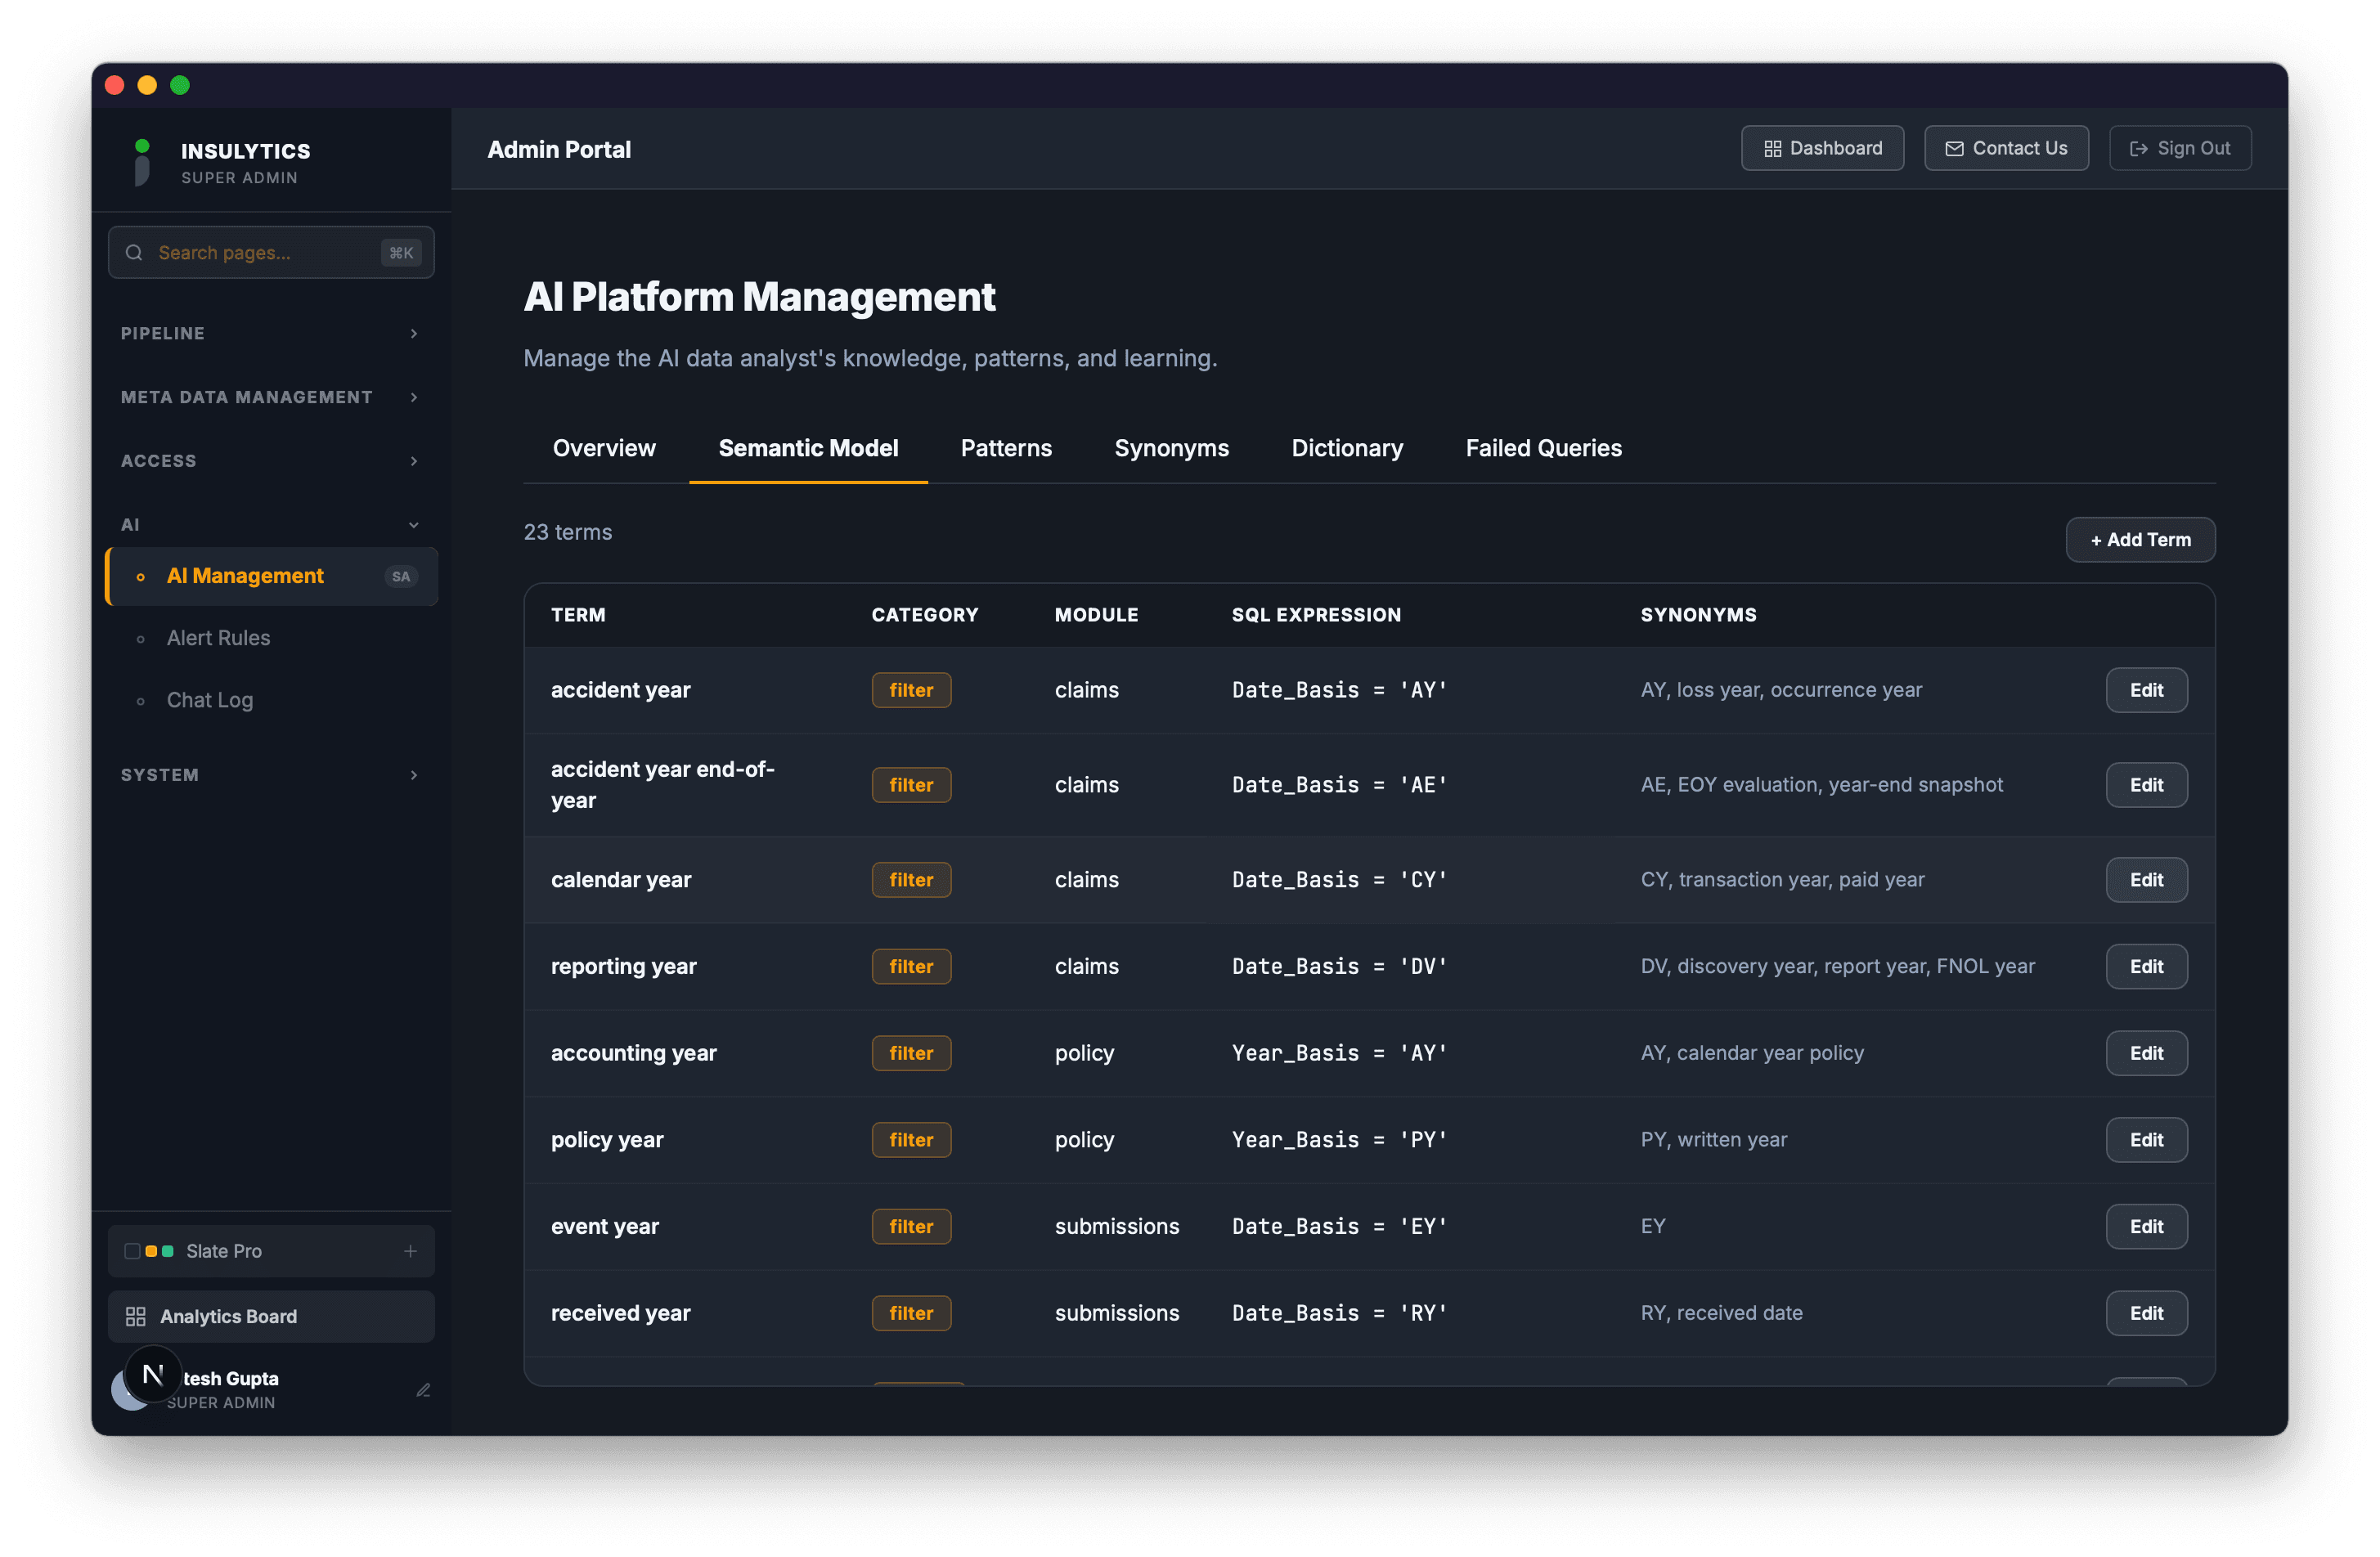
Learns Your Language
Insulytics AI builds a semantic model of your data — column definitions, business synonyms, and learned query patterns. The more your team uses it, the smarter it gets.
Next-Gen Insurance Analytics Stack
Built on Microsoft Azure with enterprise-grade security, proven methodologies, and zero experimental technology.
Azure Data Factory
Automated data ingestion pipelines with file format transformation, validation, and secure transfer protocols.
Azure SQL Database
Enterprise-grade relational database with multi-tenant architecture, automated backup, and high availability.
Next.js Portal
Modern React-based dashboard portal with dynamic updates, responsive design, and role-based access.
Insulytics AI Engine
Natural language analytics, AI-generated charts and reports, KPI threshold alerts, semantic model that learns your terminology.
Security Layer
Zero PII ingestion, end-to-end encryption, Azure AD integration, and compliance frameworks.
Expert Architecture
Proven methodologies, no experimental technology, well-thought-out design with zero guesswork.
Enterprise Security Without the Complexity
Privacy-first architecture ensures your data is protected at every layer. We never ingest PII, and every byte is encrypted in transit and at rest.
- ✓Zero PII ingestion — we never store personal data
- ✓End-to-end encryption (TLS 1.3 + AES-256 at rest)
- ✓Role-based access control with Azure AD integration
- ✓Complete data isolation — your data is yours alone
- ✓SOC 2 compliant infrastructure on Microsoft Azure
- ✓Automated backup & disaster recovery
See Your Data Come Alive
Book a free demo and see exactly how Insulytics transforms your insurance data into actionable insights.