Drive Producer Performance & Portfolio Growth
Detailed aggregator, producer, and agent scorecards with performance metrics. Submission tracking, policy analytics, commission optimization, and comprehensive trend analysis for portfolio growth management.
Challenges We Solve
Producer Performance Gaps
Without visibility into which producers drive profitable volume vs. high-loss business, you can't optimize your distribution strategy.
Hit Ratio Optimization
Understanding why submissions don't convert — and where in the cycle they fall off — requires analytics most MGAs don't have.
Commission Leakage
Manual commission tracking across multiple producers and programs leads to errors and missed optimization opportunities.
Dashboards Built for You
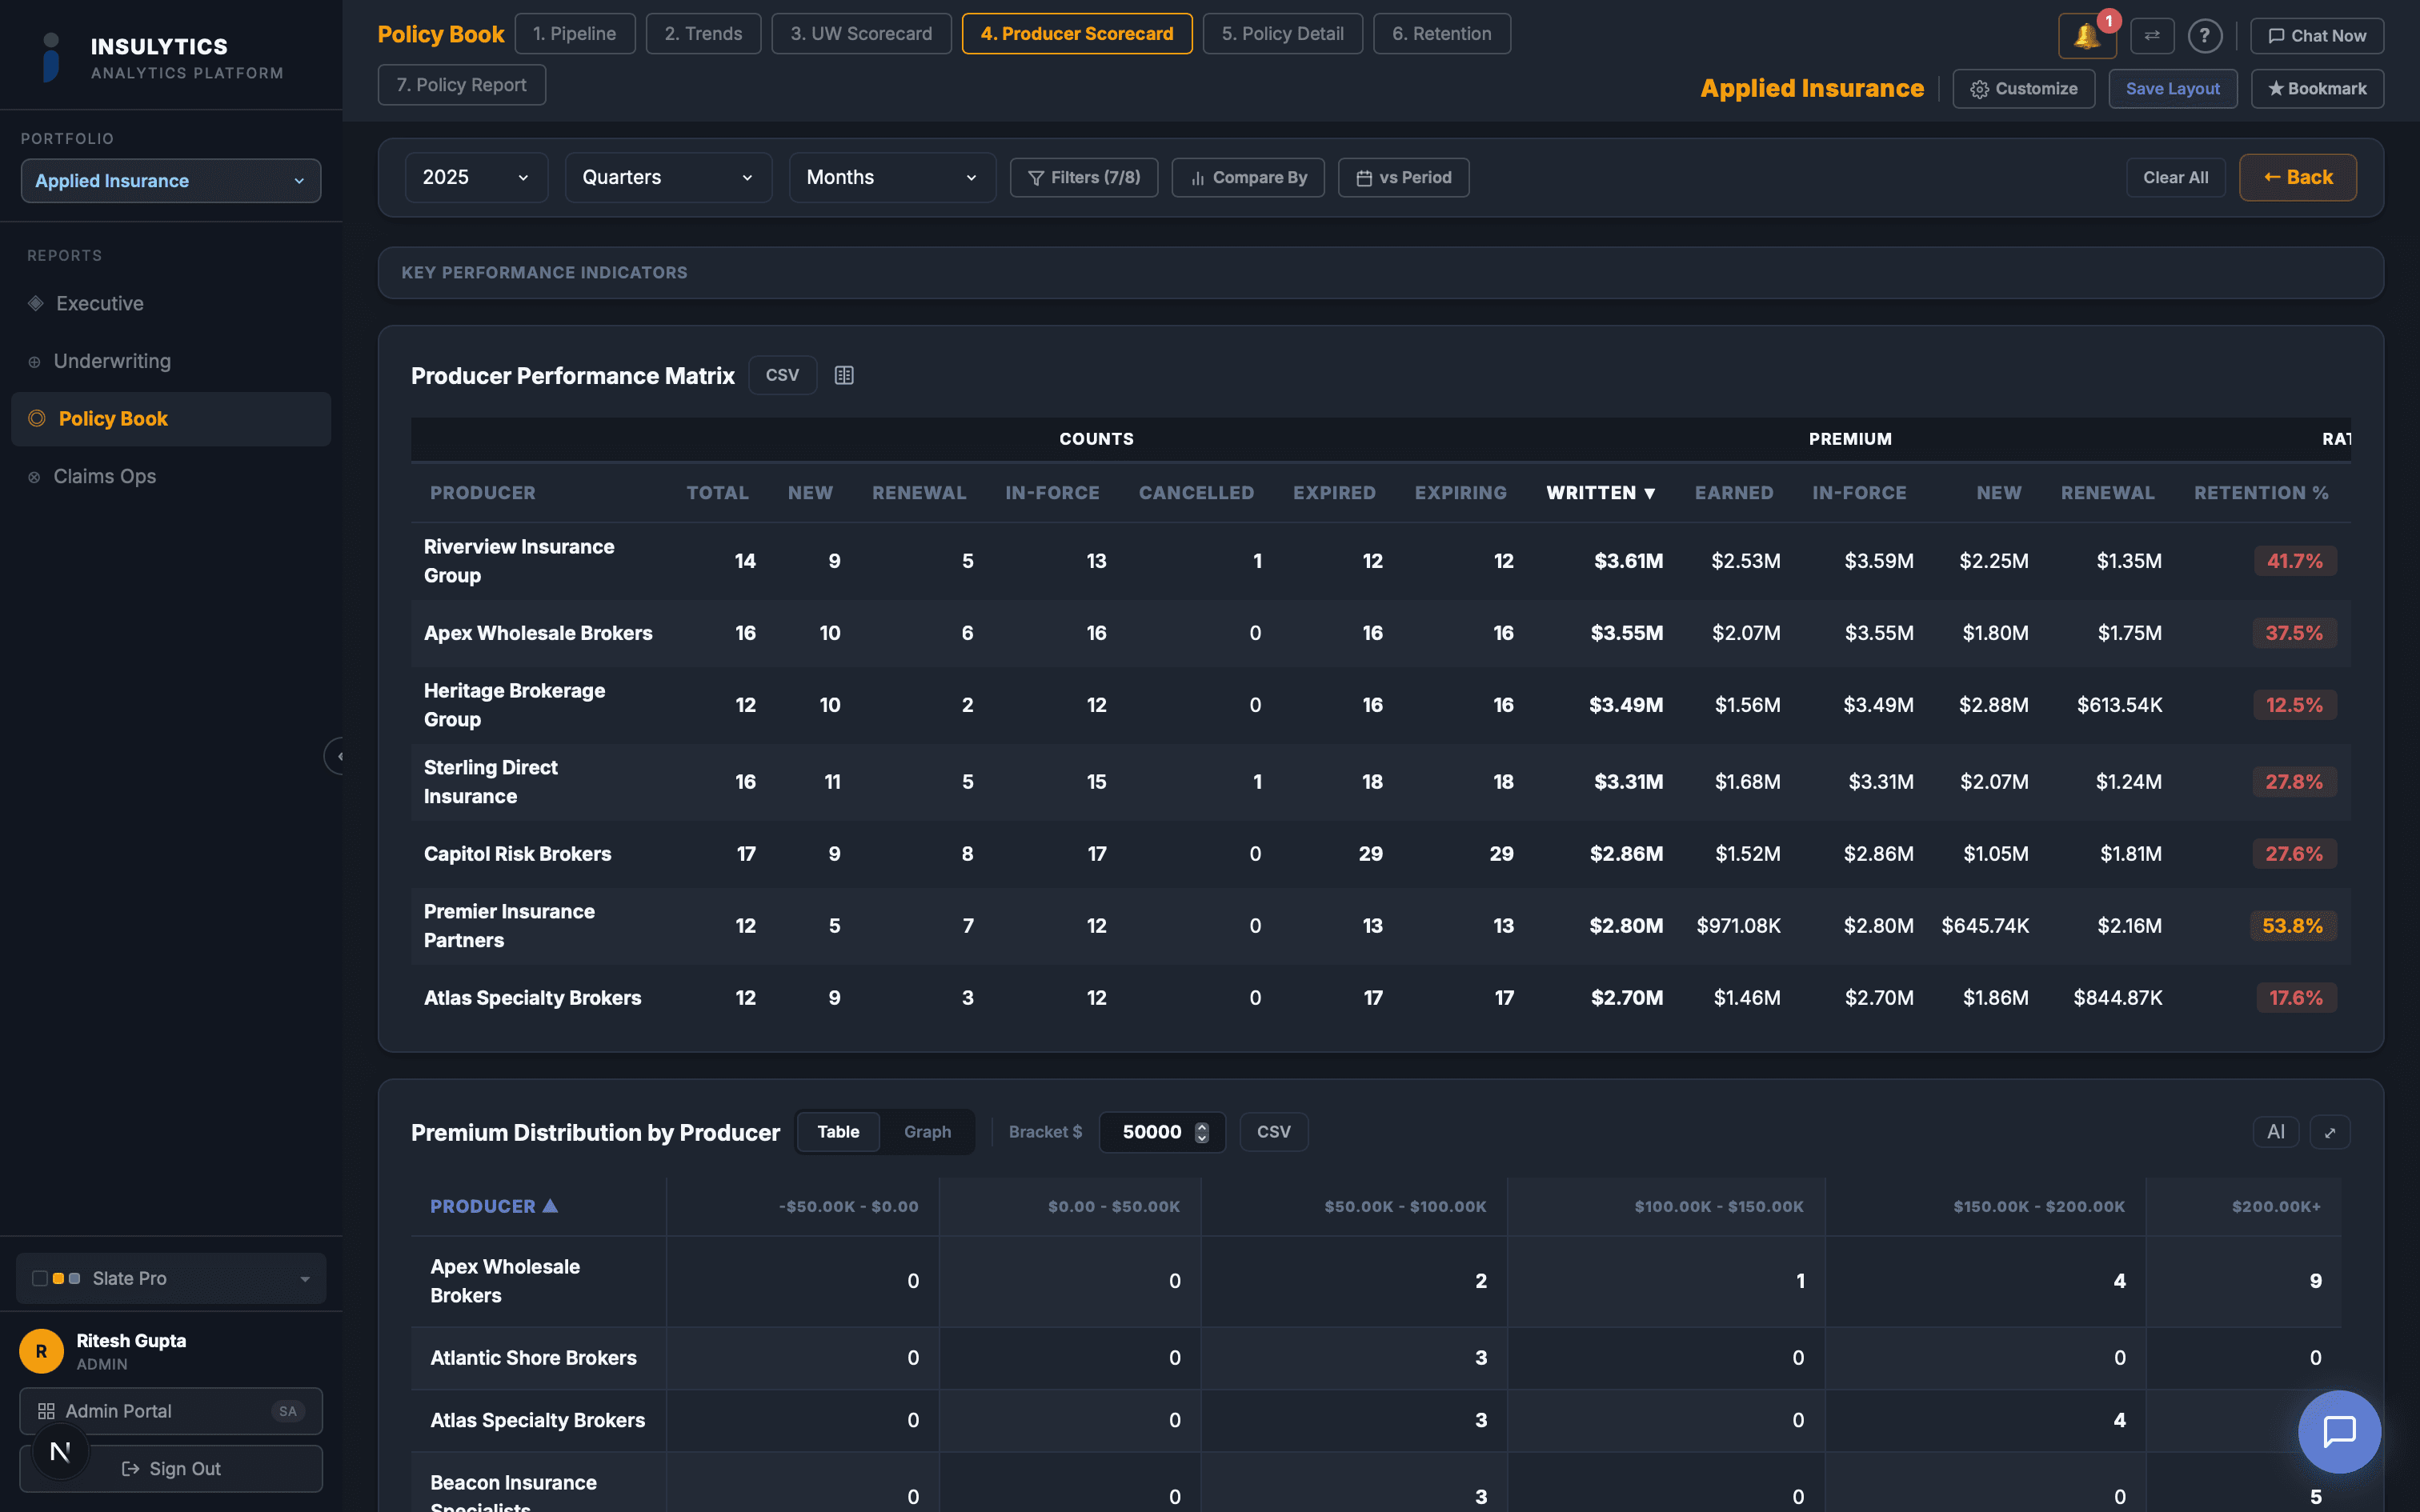
Producer Scorecard
Combined policy + claims performance per producer with multi-metric comparison charts.
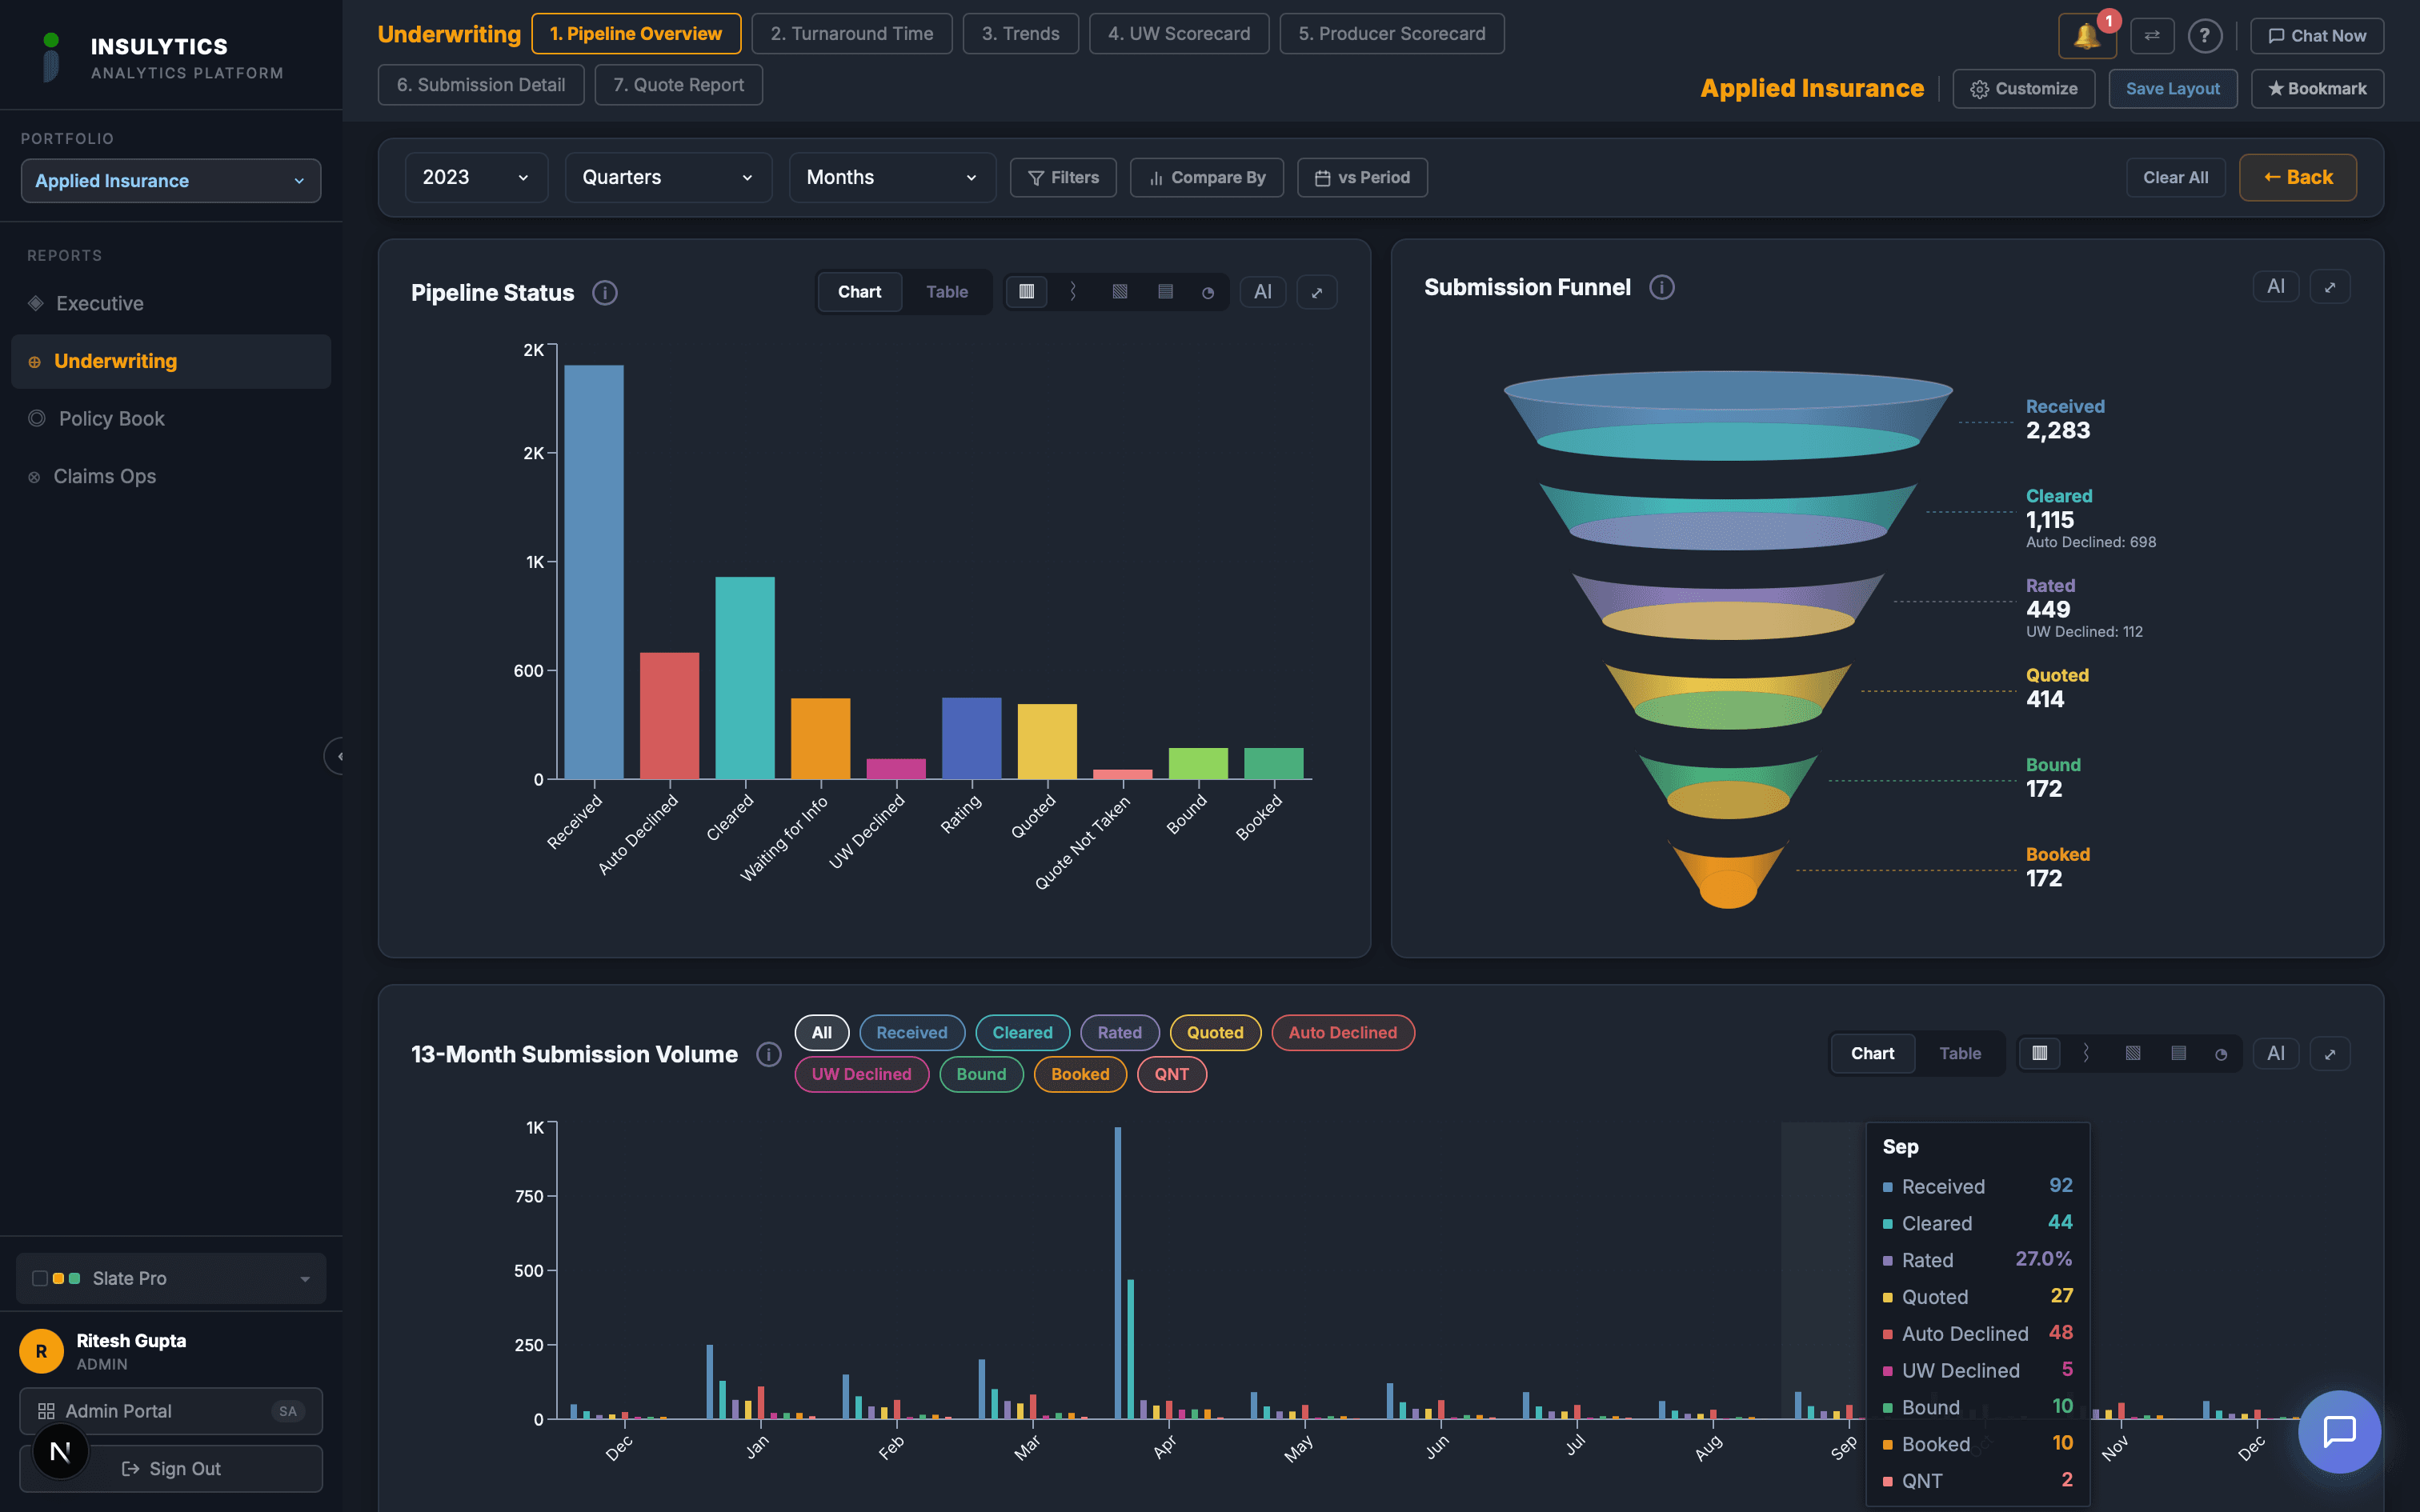
Submission Pipeline
Track every submission from receipt through bind with stage-by-stage conversion analytics.
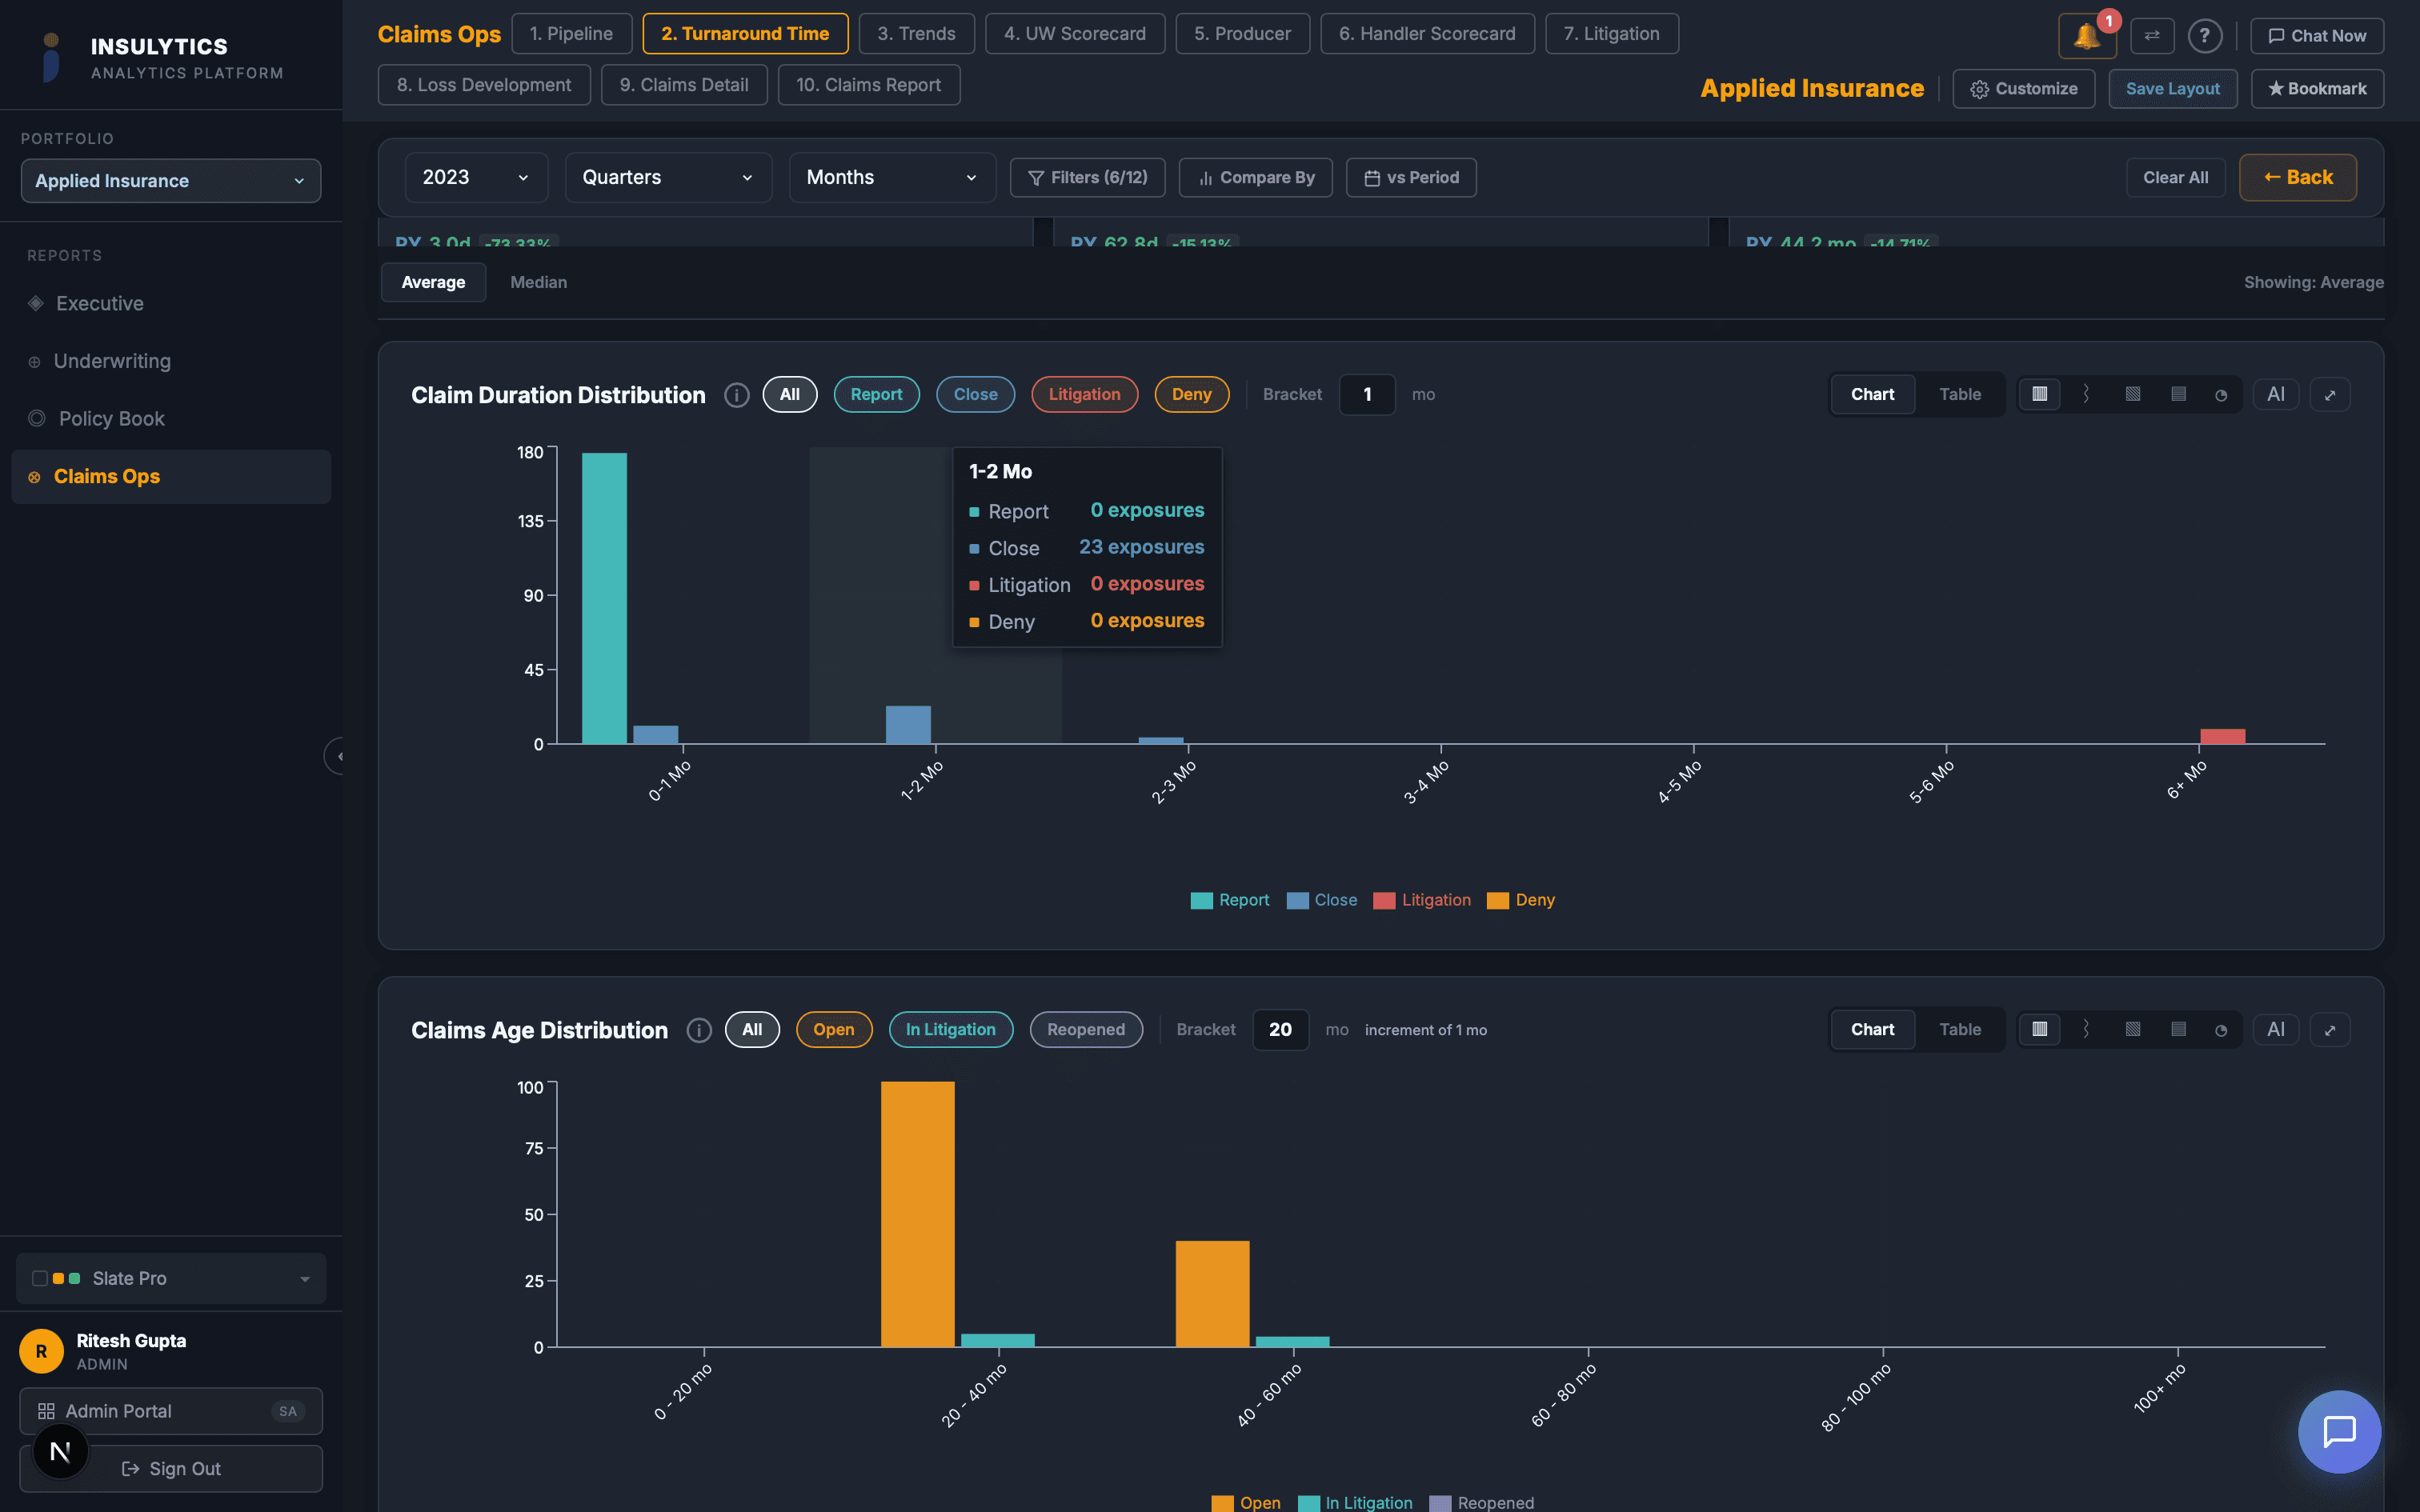
Cycle Time Analysis
Identify bottlenecks in your submission-to-bind cycle and benchmark against targets.
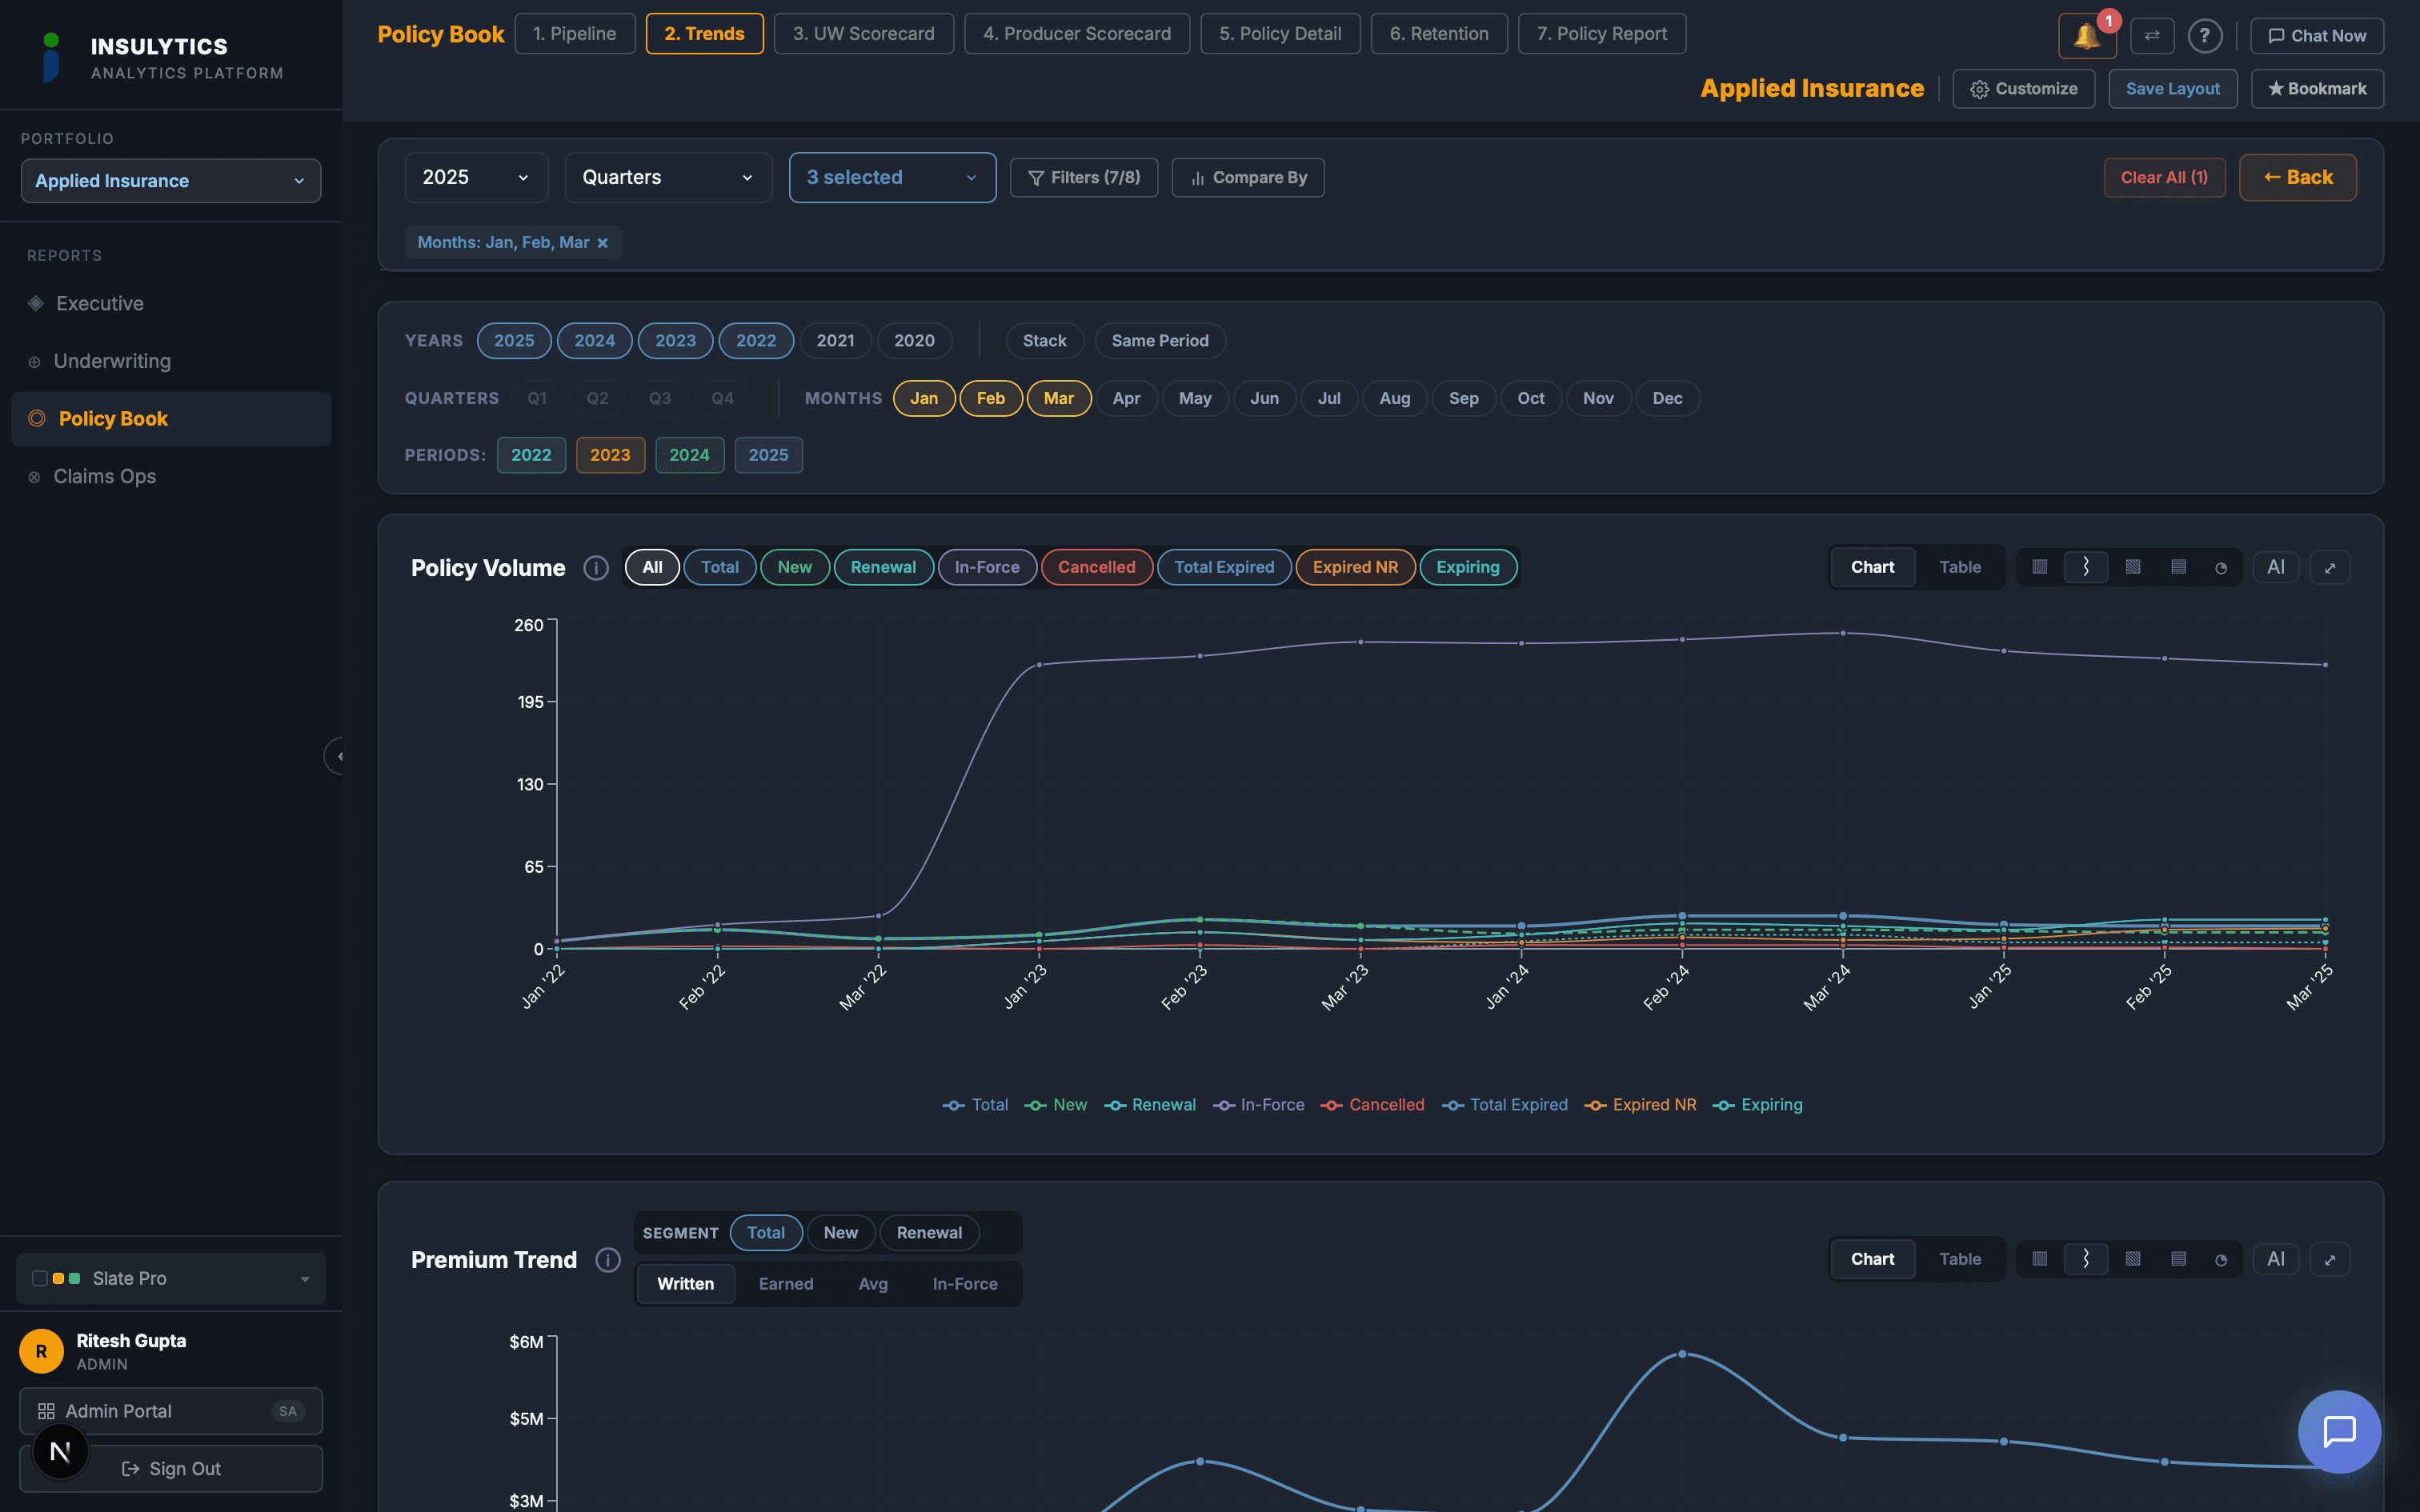
Policy Trends
Monitor book growth, retention, and renewal trends across all lines and producers.
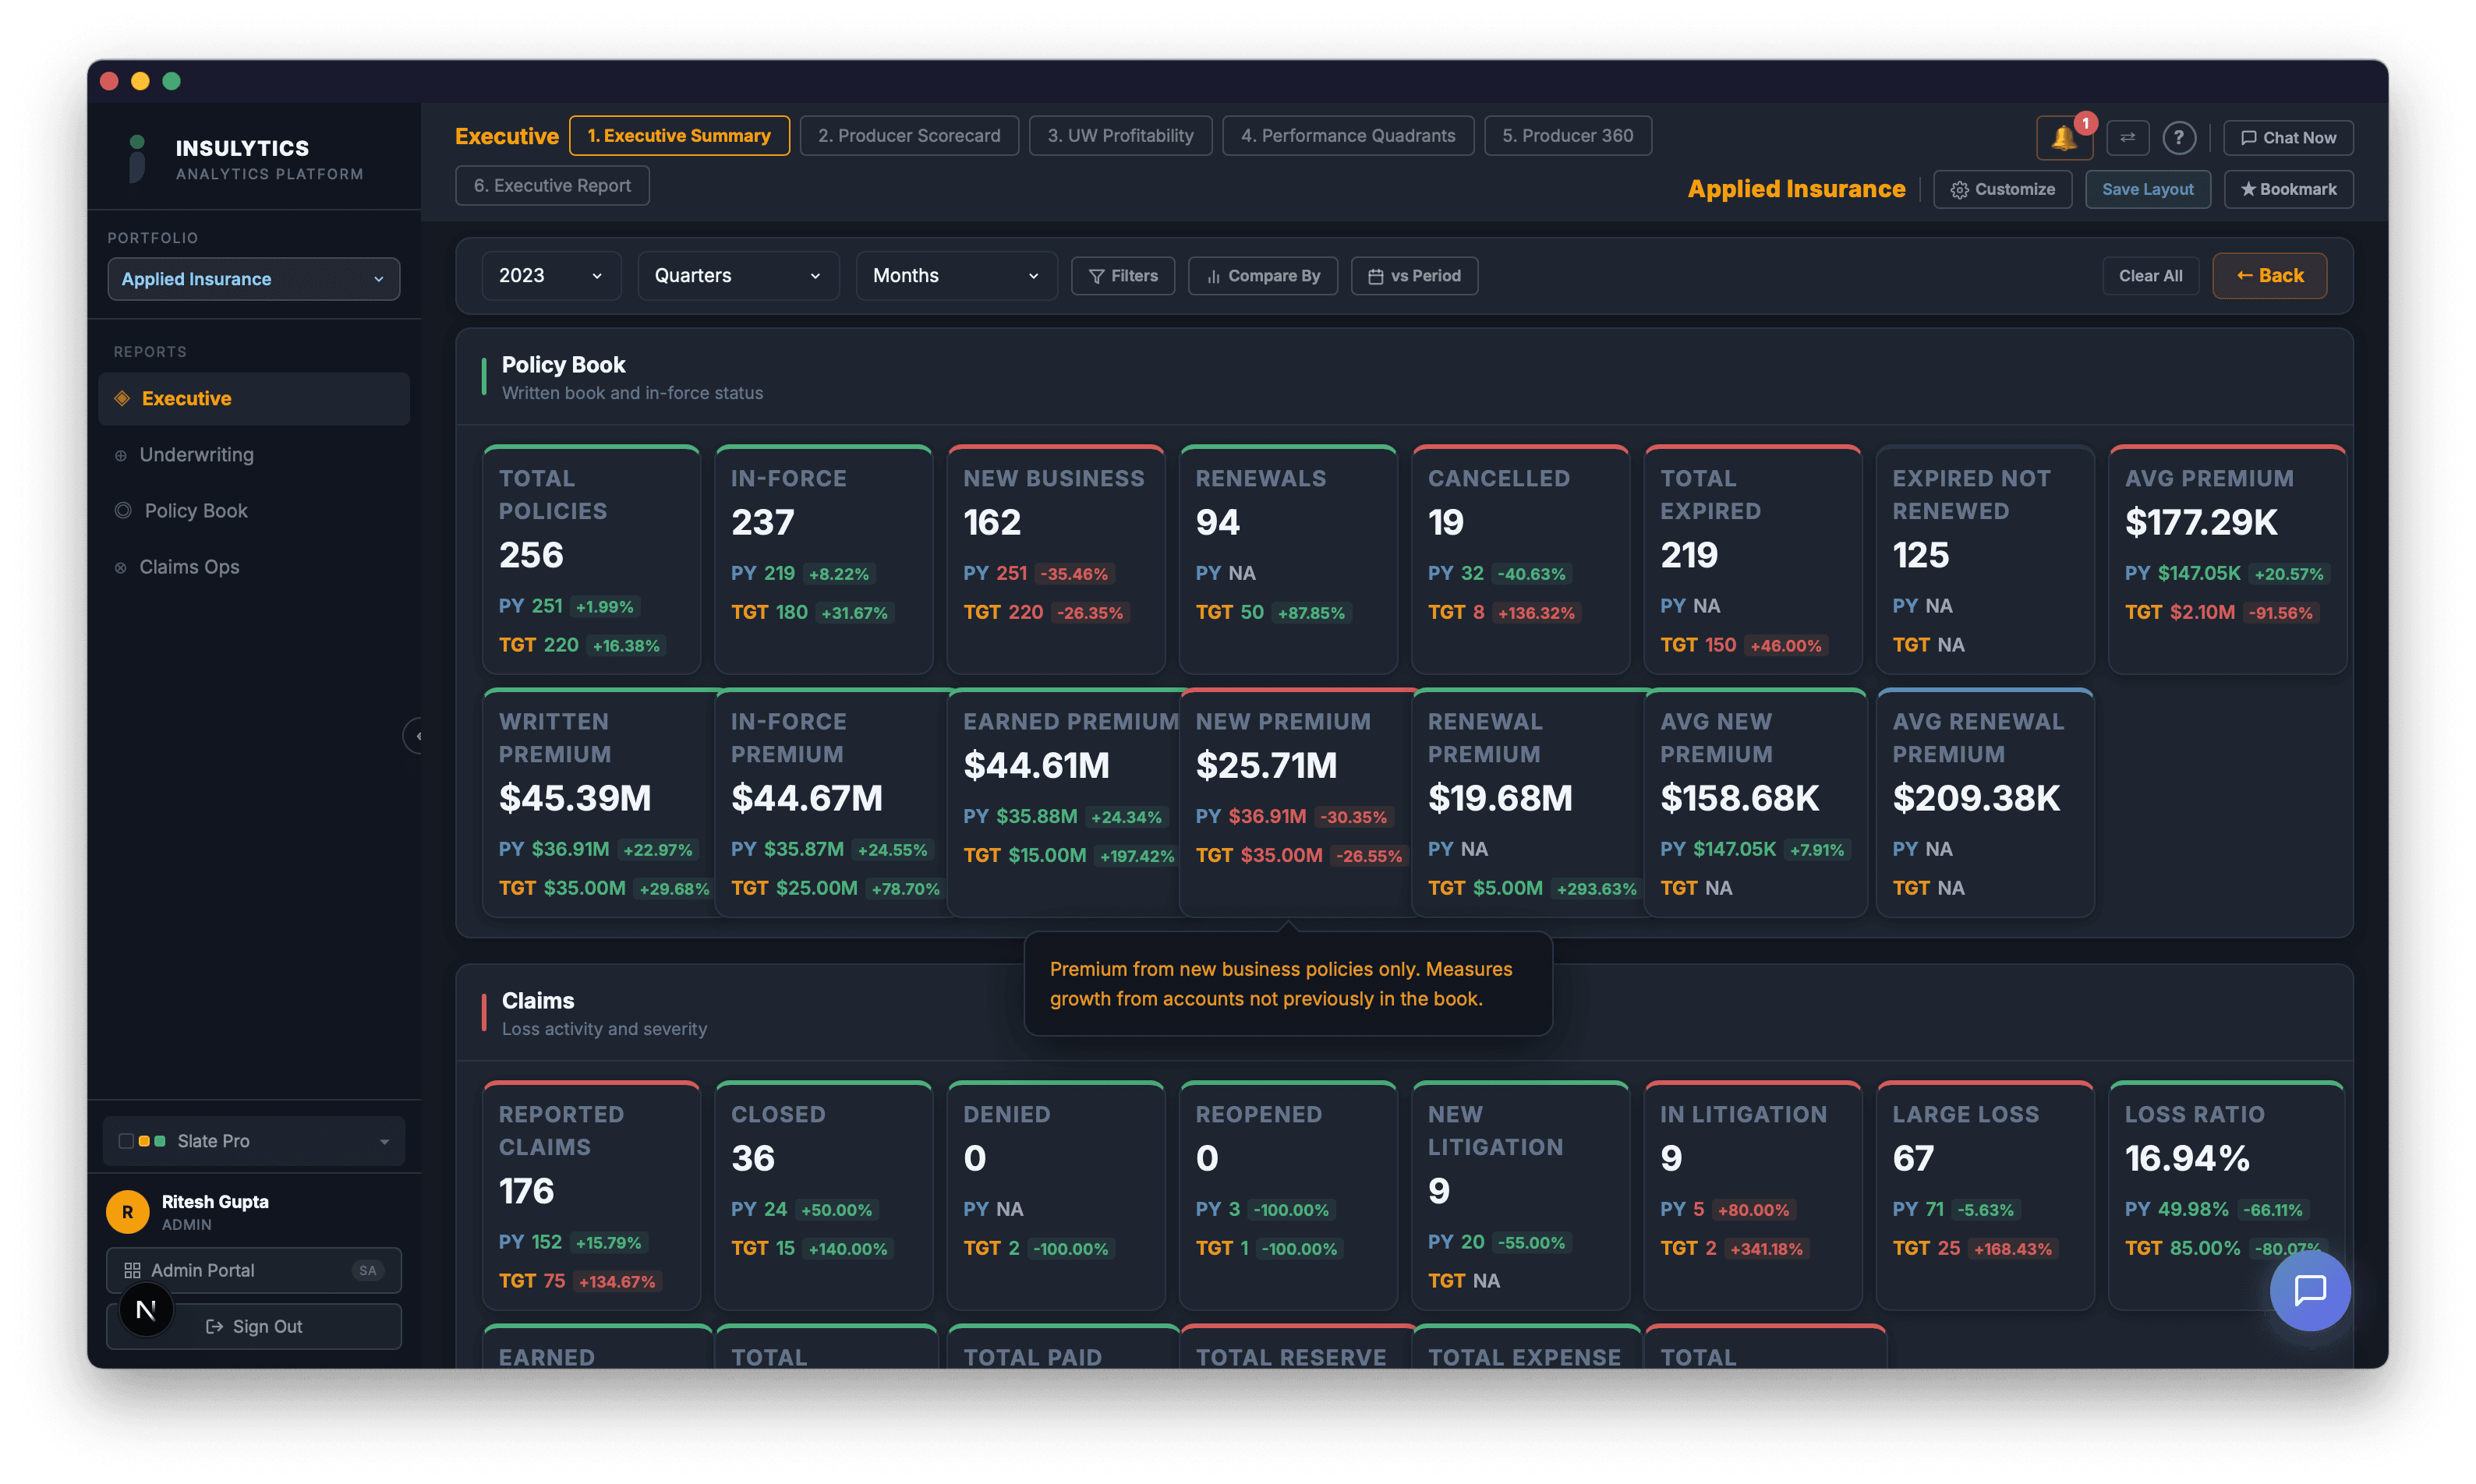
Executive Summary
Portfolio-wide KPIs with year-over-year comparison and drill-down by producer or LOB.
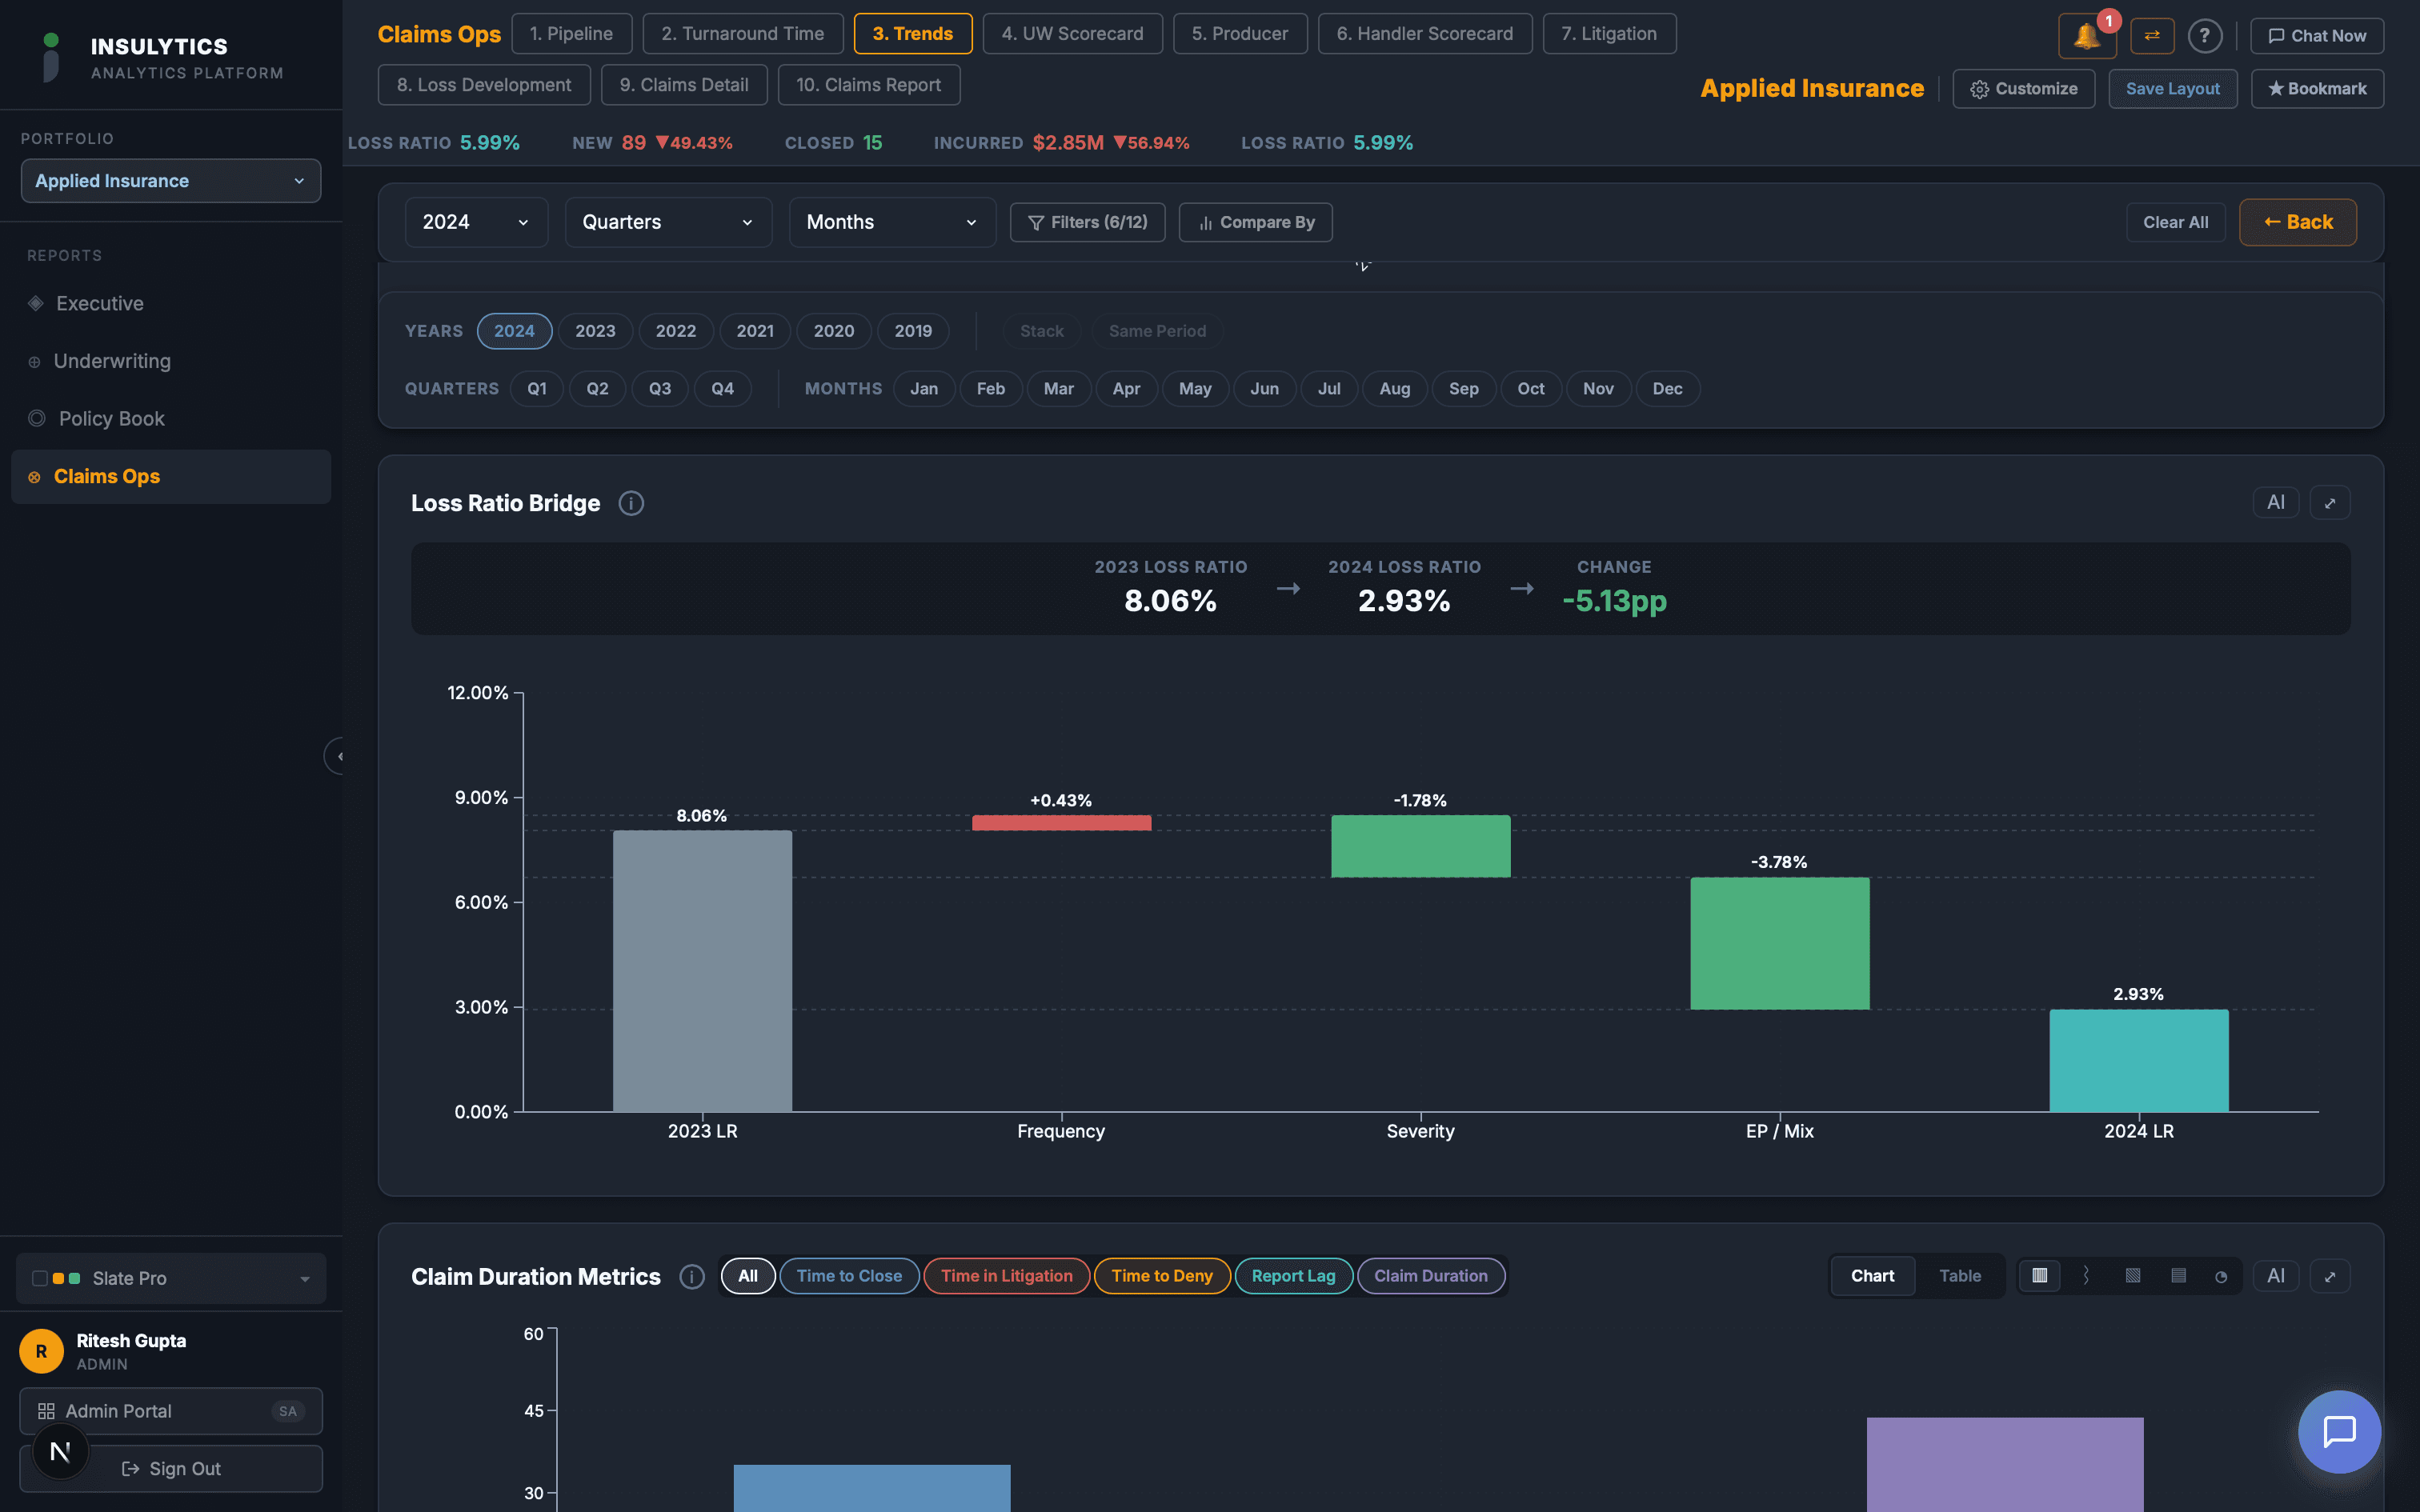
Claims Trends
Loss ratio, severity, and frequency trends across accident year and calendar year with full drill-down.
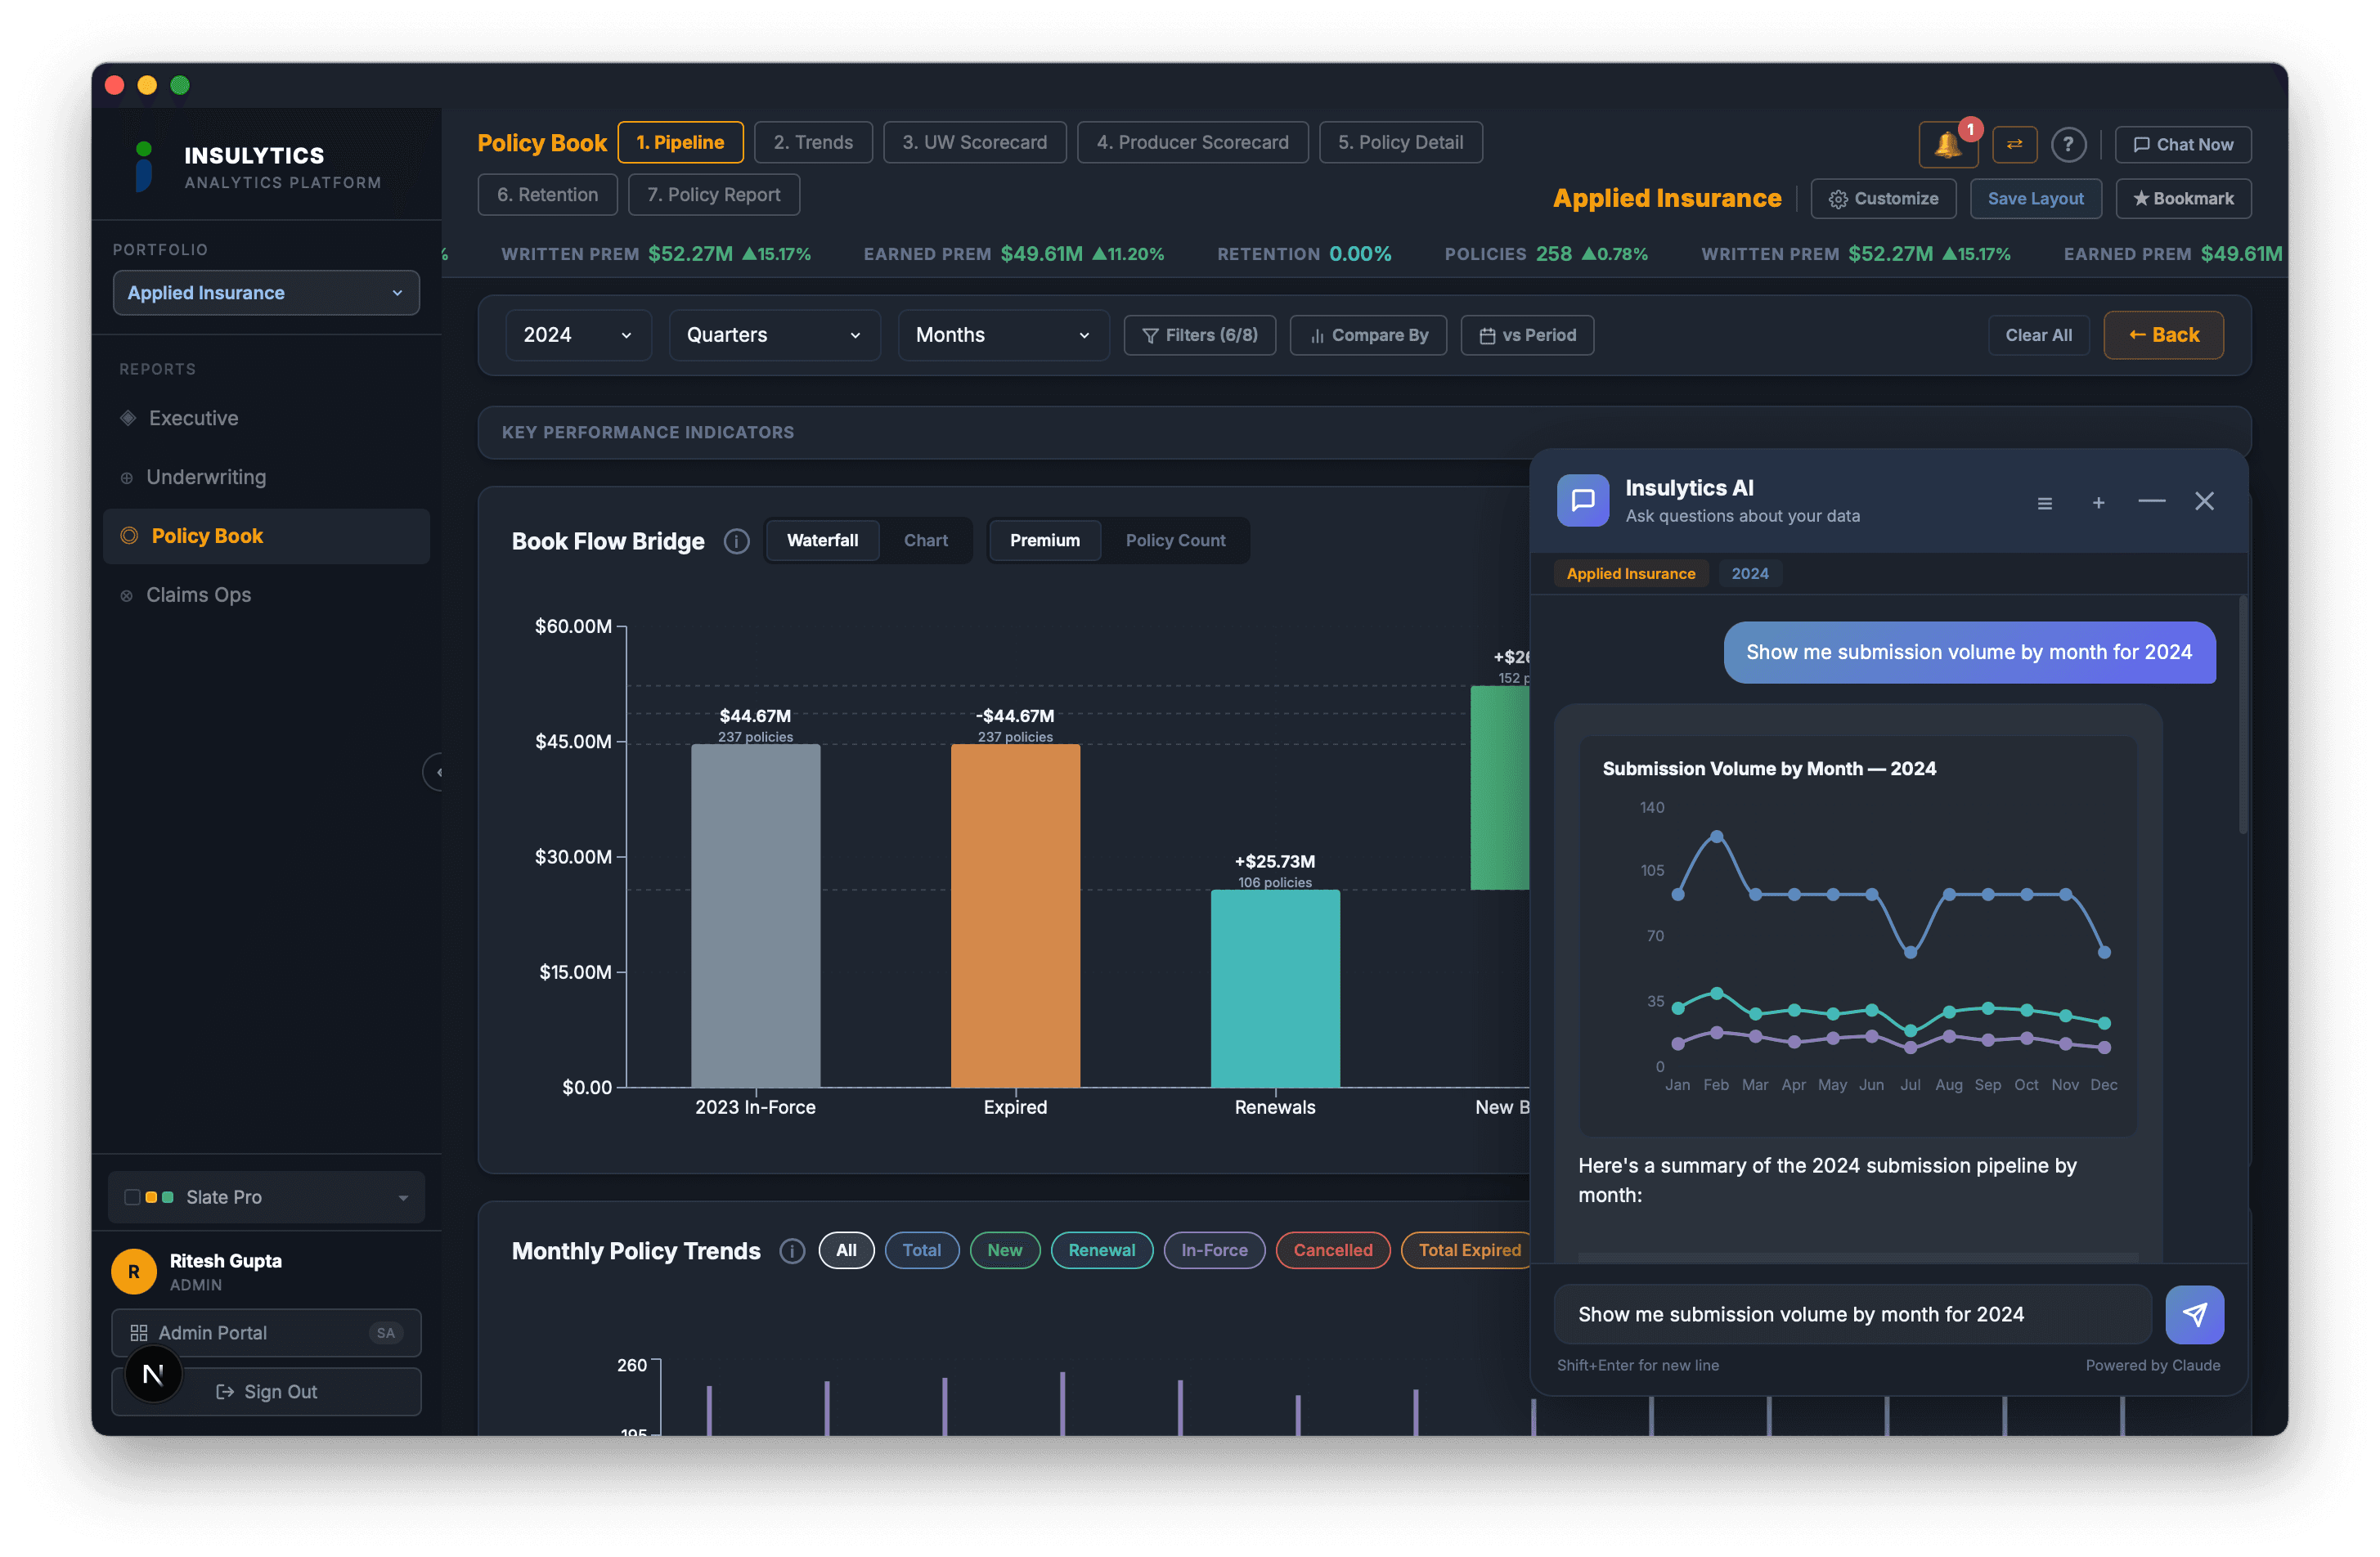
Insulytics AI
Ask questions about your producers and pipeline in plain English — get charts and reports instantly.
Measurable Impact
Improvement in hit ratio with pipeline analytics
Reduction in time spent on manual reporting
Growth in profitable premium with producer insights
Self-service analytics — no SQL or technical skills required
Unlock Your Growth Potential
Book a personalized demo and see your data transformed into actionable insights.