How AI Is Changing Insurance Analytics (Without Replacing Your Team)
AI in insurance analytics isn't about replacing underwriters or actuaries. It's about giving everyone on your team the ability to ask questions and get answers in seconds.
Let's address the elephant in the room: when insurance executives hear “AI analytics,” they picture one of two things. Either a science fiction scenario where algorithms replace their underwriting team, or a chatbot that gives generic answers pulled from the internet. Neither is what AI actually does in an insurance analytics context.
The practical reality of AI in insurance analytics is much more mundane — and much more useful. It's about reducing the friction between having a question and getting an answer. And in an industry where the average time to answer an ad-hoc data question is measured in days, that friction reduction is transformative.
The Question-to-Answer Gap
Here's a scenario that plays out dozens of times a week at every insurance organization we've worked with:
The VP of Underwriting is on a call with a large broker. The broker asks: “What was our hit ratio on habitational GL in Texas last year, and how does it compare to this year?” The VP knows the answer exists in their data. But getting it requires ending the call, emailing the analytics team, waiting for someone to pull the data, and then calling the broker back — usually the next day.
By then, the moment has passed. The broker has moved on to the next conversation. The VP answered “I'll get back to you” instead of “let me pull that up right now.”
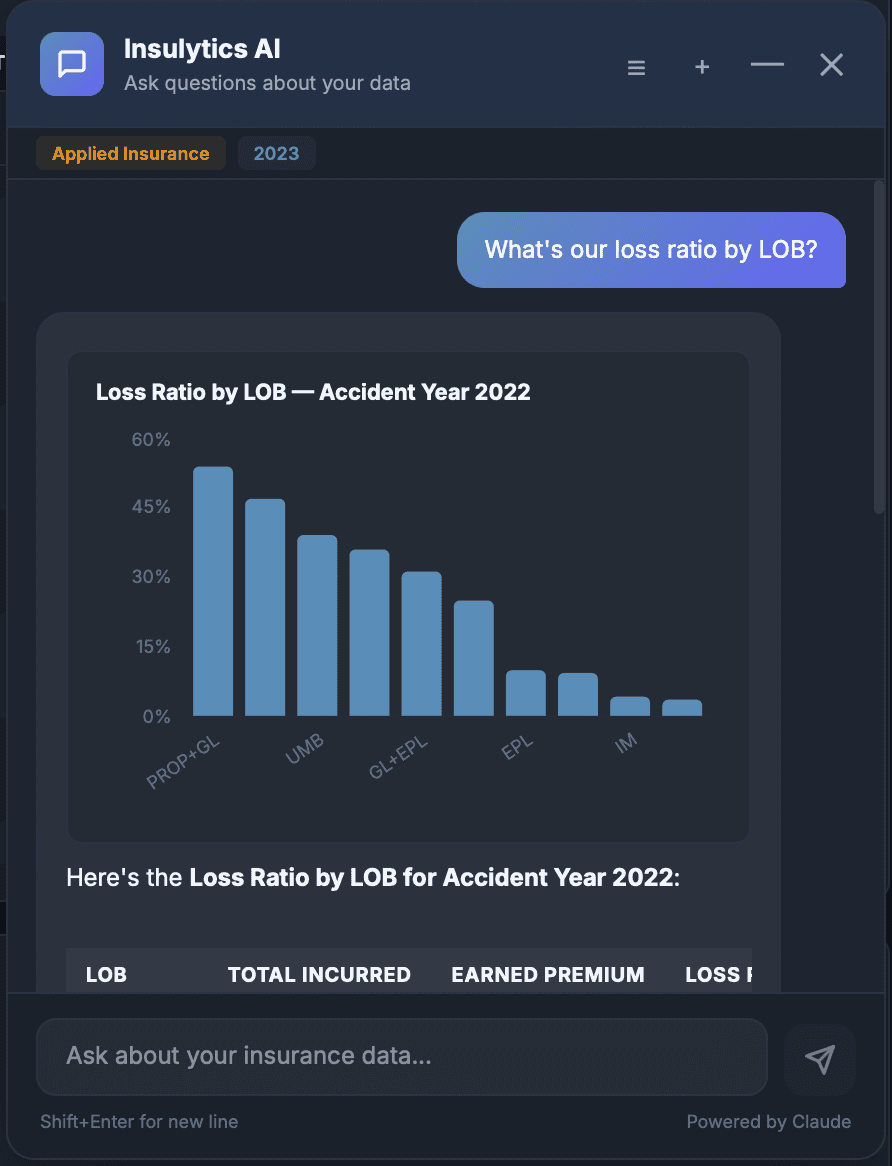
AI closes that gap. The VP types the question into a chat panel — in plain English, not SQL — and gets the answer in seconds. A table showing the hit ratio breakdown, or a chart comparing the two periods visually. On the same call. No email, no ticket, no waiting.
What AI Actually Does Under the Hood
When a user types “What's our GL loss ratio by state for accident year 2024?”, the AI doesn't guess. It follows a precise process:
- Understands the intent. The AI parses the natural language question and identifies the key elements: metric (loss ratio), dimension (state), filter (LOB = GL), date basis (accident year), period (2024).
- Maps to your schema.Using a semantic model that understands your specific data structure — your table names, column names, and business terminology — the AI translates the intent into a precise database query. If your organization calls it “line of business” and your database column is “LOB_Code,” the AI knows the mapping.
- Generates and validates SQL. The AI writes a SQL query against your data warehouse, validates it for correctness (does the table exist? does the filter value match?), and executes it.
- Presents the result. Based on the shape of the data returned, the AI selects the appropriate visualization — a table for detailed lookups, a bar chart for comparisons, a line chart for trends — and renders it directly in the chat.
The entire process takes 3-8 seconds. No SQL knowledge required. No report request. No waiting.
Beyond Chat: AI-Powered Alerts
The chat interface is the most visible AI feature, but it's not the most valuable. The most valuable AI application in insurance analytics is proactive alerting — the system telling you something is wrong before you think to ask.
Traditional insurance reporting is reactive: you run a report, notice a number looks off, investigate, and take action. By the time you see the problem, it's been building for weeks or months.
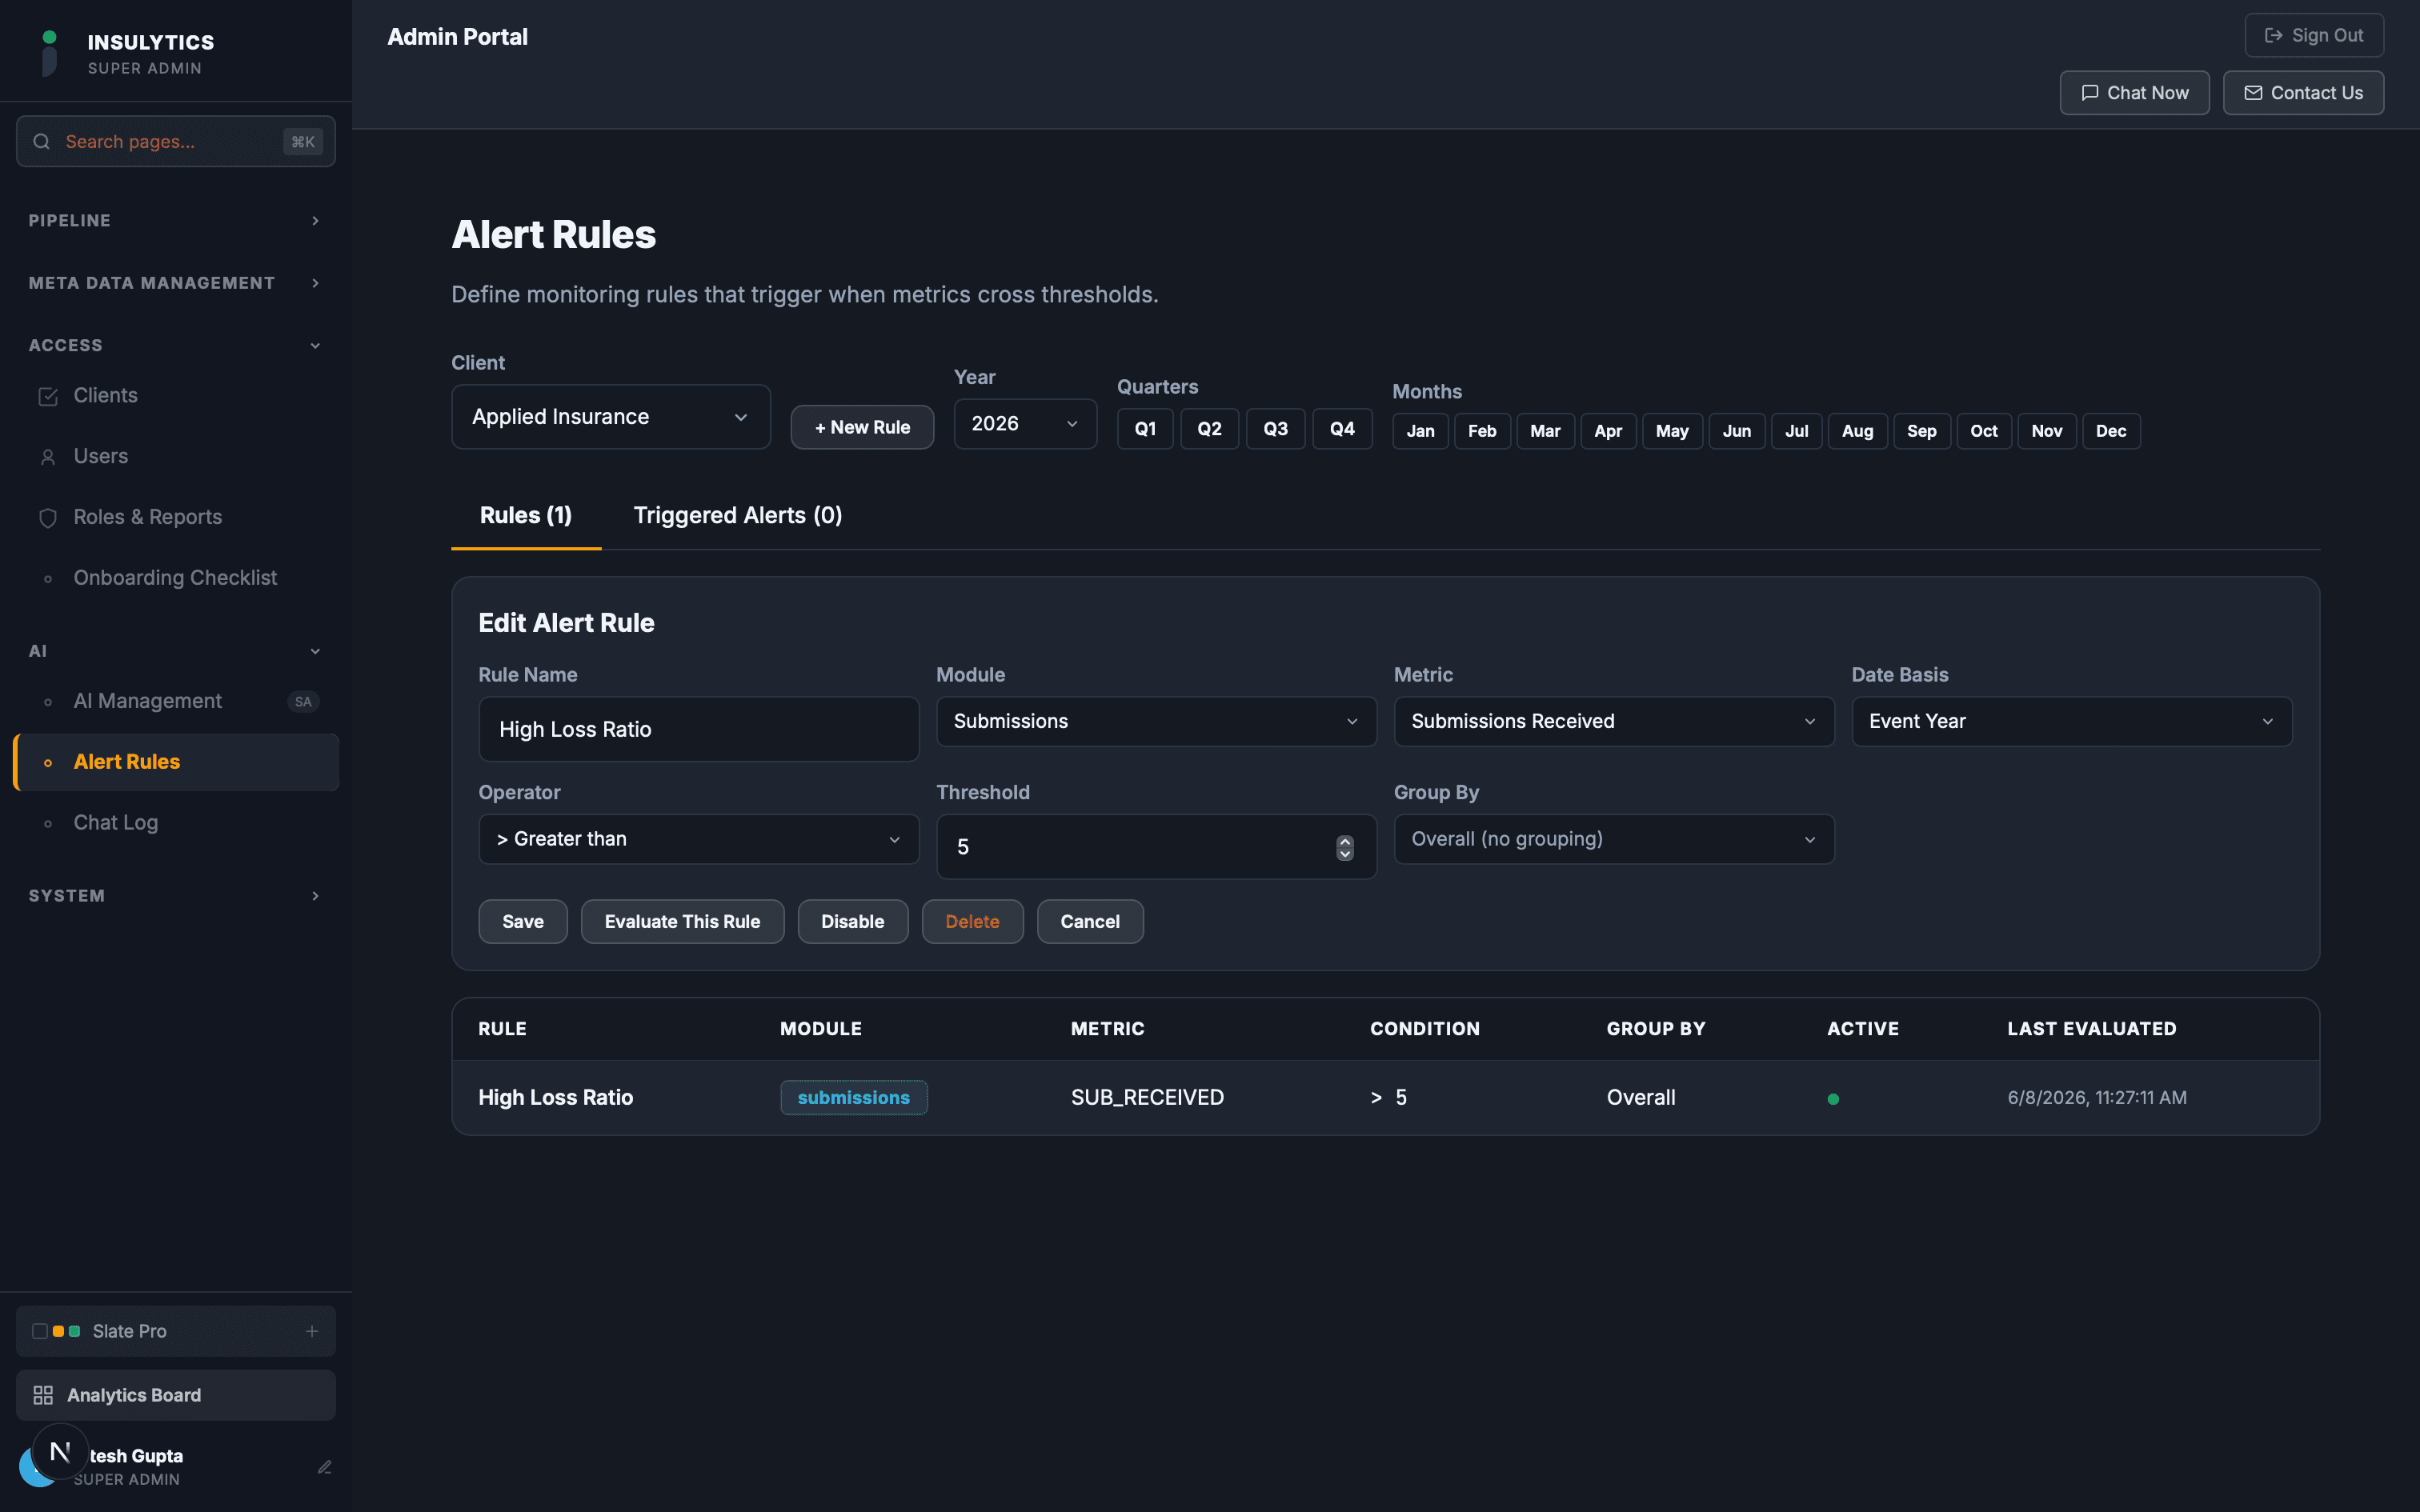
AI-powered threshold alerts flip this model. You define the conditions that matter:
- “Alert me when loss ratio for any LOB exceeds 65% in a rolling quarter.”
- “Alert me when any underwriter's hit ratio drops below 15%.”
- “Alert me when stalled submissions exceed 50 for more than 3 consecutive days.”
- “Alert me when retention for any state drops below 70%.”
The system monitors these conditions continuously and notifies you when a threshold is crossed. You don't need to remember to check. You don't need to run a report. The insight comes to you.
One MGU we work with set an alert on their Cyber line: “Notify when retention drops below 75% in a rolling quarter.” The alert fired 6 weeks before the trend would have appeared in their quarterly report. That early warning gave them time to implement a proactive renewal outreach program that recovered 12 accounts that would otherwise have been lost.
AI-Generated Reports
The third practical AI application is report generation. Insurance executives spend an extraordinary amount of time on reports — board reports, committee reports, broker stewardship reports, producer performance summaries. Each one requires someone to pull data, format it, add narrative commentary, and produce a document.
AI can generate these reports on demand. A user specifies the parameters — time period, LOB, dimension grouping, comparison basis — and the AI assembles the report: data tables, summary statistics, trend charts, and narrative commentary explaining the key variances.
This doesn't eliminate the need for human review. The CUO still reads the report before it goes to the board. But the 10-hour assembly process becomes a 10-minute generation process, and the CUO's time shifts from building the report to analyzing it.
The Semantic Model: Why It Gets Smarter Over Time
The quality of AI-powered analytics depends entirely on how well the system understands your data. A generic AI model doesn't know that “BOP” means Business Owners Policy, that “NB” means New Business, or that when your VP says “the book” she means the in-force policy portfolio.
A well-designed AI analytics system maintains a semantic model — a knowledge layer that maps business terminology to database objects. This model includes:
- Column definitions: What each field means in business terms (not just the database column name)
- Synonyms:“Hit ratio” and “bind ratio” and “conversion rate” all map to the same calculation
- Learned patterns: When users ask a question that the AI successfully answers, the query pattern is cached so similar questions are faster and more accurate next time
- Business rules:“Loss ratio” means incurred losses divided by earned premium at this company, not written premium
The model starts with a baseline built during implementation and improves over time as users interact with the system. Every successful query reinforces the mapping. Every correction (user feedback) refines it. After 3-6 months of active use, the AI understands your organization's terminology as well as your senior analyst does.
What AI Doesn't Replace
AI in insurance analytics does not replace:
- Underwriting judgment.The AI can tell you that your GL loss ratio in Florida is 85%. It cannot tell you whether to tighten your appetite, raise rates, or exit the market. That's a business decision that requires context, relationships, and strategic judgment that no model possesses.
- Actuarial analysis. Reserving, rate adequacy studies, and stochastic modeling require specialized expertise and regulatory understanding that goes far beyond data retrieval.
- Relationship management.The VP who knows that a broker's complaint about turnaround time is really about feeling undervalued — that's human intelligence that AI can't replicate.
What AI replaces is the friction between a question and an answer. It replaces the email to the analytics team, the 2-day wait for a report, the spreadsheet somebody builds and nobody maintains. It gives every person in the organization the ability to interrogate the data directly — and that changes the speed and quality of decisions at every level.
The carriers, MGAs, and MGUs that adopt AI analytics aren't replacing their teams. They're arming them. An underwriter with instant access to loss ratio trends by class code makes better risk selection decisions. A distribution leader who can pull producer performance metrics during a call has more productive conversations. A claims manager who gets an alert when severity spikes in a specific line can intervene weeks earlier.
That's not science fiction. That's a better-informed team making faster decisions with the data they already have.